$user = $this->Session->read('Auth.User');
//find the group of logged user
$groupId = $user['Group']['id'];
$viewFile = '/var/www/html/newbusinessage.com/app/View/Articles/view.ctp'
$dataForView = array(
'article' => array(
'Article' => array(
'id' => '9971',
'article_category_id' => '1',
'title' => 'Nepse Analysis for 6 Feb.',
'sub_title' => '',
'summary' => 'Today’s trading volume Rs 23.100 crores has been lower as compared to yesterday’s trading volume of Rs 36.436 Crores. ',
'content' => '<p>
<strong>CMP: 1147.10 NEPSE</strong></p>
<p>
<strong>The pivot table for tomorrow (23<sup>rd</sup> Magh)</strong></p>
<table align="left" border="1" cellpadding="0" cellspacing="0" style="width:658px;" width="658">
<tbody>
<tr>
<td style="width:94px;height:23px;">
<p>
<strong>S3</strong></p>
</td>
<td style="width:94px;height:23px;">
<p>
<strong>S2</strong></p>
</td>
<td style="width:94px;height:23px;">
<p>
<strong>S1</strong></p>
</td>
<td style="width:88px;height:23px;">
<p>
<strong>P</strong></p>
</td>
<td style="width:96px;height:23px;">
<p>
<strong>R1</strong></p>
</td>
<td style="width:96px;height:23px;">
<p>
<strong>R2</strong></p>
</td>
<td style="width:96px;height:23px;">
<p>
<strong>R3</strong></p>
</td>
</tr>
<tr>
<td style="width:94px;height:23px;">
<p>
1139.77</p>
</td>
<td style="width:94px;height:23px;">
<p>
1142.02</p>
</td>
<td style="width:94px;height:23px;">
<p>
1144.56</p>
</td>
<td style="width:88px;height:23px;">
<p>
<strong>1146.81</strong></p>
</td>
<td style="width:96px;height:23px;">
<p>
1149.35</p>
</td>
<td style="width:96px;height:23px;">
<p>
1151.60</p>
</td>
<td style="width:96px;height:23px;">
<p>
1154.14</p>
</td>
</tr>
</tbody>
</table>
<p>
</p>
<p>
</p>
<p>
</p>
<p>
</p>
<p>
<span style="font-size:14px;"><span style="font-family:arial,helvetica,sans-serif;">Today’s (22<sup>nd </sup>Magh) volume : Rs 23.100 crores</span></span></p>
<p>
<span style="font-size:14px;"><span style="font-family:arial,helvetica,sans-serif;">Yesterdays (21<sup>st</sup> Magh) volume : Rs 36.436 crores</span></span></p>
<p>
<span style="font-size:14px;"><span style="font-family:arial,helvetica,sans-serif;"><strong>The Trading volume:</strong></span></span></p>
<p>
<span style="font-size:14px;"><span style="font-family:arial,helvetica,sans-serif;">Today’s trading volume Rs 23.100 crores has been lower as compared to yesterday’s trading volume of Rs 36.436 Crores. The trading volume does not show a promising bullish outlook when market has closed green and above the daily pivot.</span></span></p>
<p>
<span style="font-size:14px;"><span style="font-family:arial,helvetica,sans-serif;"><strong>Commentary:</strong></span></span></p>
<ul>
<li>
<span style="font-size:14px;"><span style="font-family:arial,helvetica,sans-serif;">- Market seems finding support and has grown higher than yesterdays close.</span></span></li>
<li>
<span style="font-size:14px;"><span style="font-family:arial,helvetica,sans-serif;">- Current market price 1147.10 is higher than tomorrows pivot 1146.81; that indicates market with further growth.</span></span></li>
<li>
<span style="font-size:14px;"><span style="font-family:arial,helvetica,sans-serif;">- Today market traded in lower volume than the yesterdays.</span></span></li>
</ul>
<p>
<span style="font-size:14px;"><span style="font-family:arial,helvetica,sans-serif;"><strong>Recommendations: </strong></span></span></p>
<ul>
<li>
<span style="font-size:14px;"><span style="font-family:arial,helvetica,sans-serif;">- Market may move up if sustained over the pivot 1146.81 but the lower trading volume today keeps all the analysts and traders in the chaos.</span></span></li>
<li>
<span style="font-size:14px;"><span style="font-family:arial,helvetica,sans-serif;">- If trading volume increases with rise in Nepse value tomorrow, the market may target to the weekly pivot 1164.683 which seems virtual at this time.</span></span></li>
<li>
<span style="font-size:14px;"><span style="font-family:arial,helvetica,sans-serif;">- Still the aggressive traders may sell some of their portfolios if they get an exit point to find another support level as an entry point in near future.</span></span></li>
</ul>
<p>
<span style="font-size:14px;"><span style="font-family:arial,helvetica,sans-serif;"><strong>Fundamental Outlook:</strong></span></span></p>
<ul>
<li>
<span style="font-size:14px;"><span style="font-family:arial,helvetica,sans-serif;">- The liquidity crisis in Banks seems still persisting and this has been major factor to affect the stock market in negative prices.</span></span></li>
<li>
<span style="font-size:14px;"><span style="font-family:arial,helvetica,sans-serif;">- Government is in verge to review the half annually performances of the current fiscal year. If government shows a probability to spend on the expenditures, the liquidity problem for the short period would be eased to relax the stock market for a price growth.</span></span></li>
<li>
<span style="font-size:14px;"><span style="font-family:arial,helvetica,sans-serif;">- The brokers’ branches out of Kathmandu may not only add the number of traders but may add the value too as a positive effect on market for the price elevation.</span></span></li>
</ul>
<p>
<span style="font-family:arial,helvetica,sans-serif;">Happy Trading……..!!!!!</span></p>
<p>
<img alt="" src="/app/webroot/userfiles/images/nepse.jpg" style="width: 500px; height: 395px;" /></p>
<p>
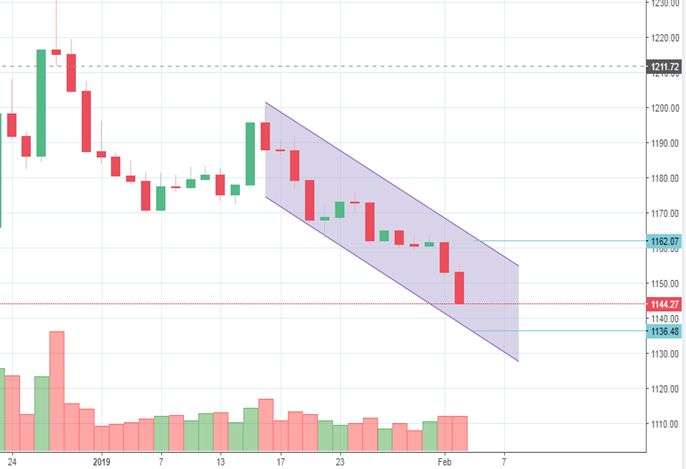
<strong><span style="font-size:14px;"><span style="font-family:arial,helvetica,sans-serif;">Nepse Daily Candle Chart Illustrates:</span></span></strong></p>
<ol>
<li>
<span style="font-size:14px;"><span style="font-family:arial,helvetica,sans-serif;">- A small green after two consecutive red. Is it harami candle stick pattern?</span></span></li>
<li>
<span style="font-size:14px;"><span style="font-family:arial,helvetica,sans-serif;">- Market inside a triangle where support lies at 1143.9 and resistant at level 1163.02</span></span></li>
<li>
<span style="font-size:14px;"><span style="font-family:arial,helvetica,sans-serif;">- If the trading volume rises with bullish mindset of investors market may target the weekly pivot value 1162 level.</span></span></li>
<li>
<span style="font-size:14px;"><span style="font-family:arial,helvetica,sans-serif;">- If market does not show a sign of recovery then market shall break the current support level to find a new low.</span></span></li>
</ol>
<p>
<img alt="" src="/app/webroot/userfiles/images/sens.jpg" style="width: 500px; height: 419px;" /></p>
<p>
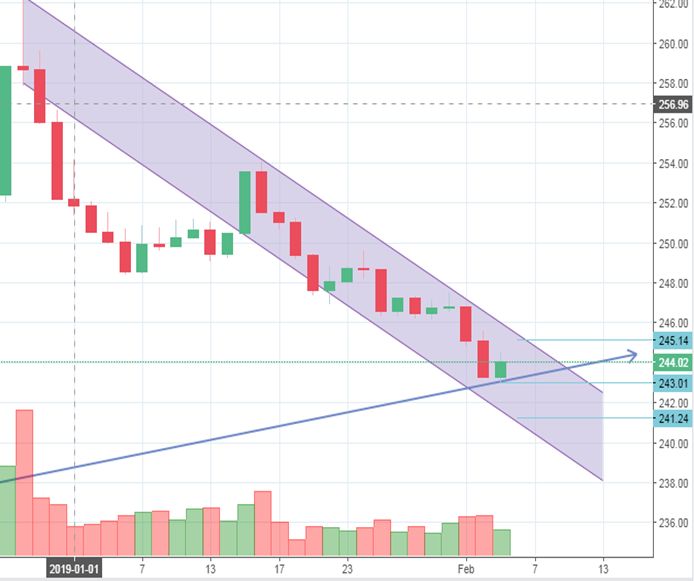
<strong><span style="font-size:14px;"><span style="font-family:arial,helvetica,sans-serif;">Sensitive index daily candle chart illustrates:</span></span></strong></p>
<ol>
<li>
<span style="font-size:14px;"><span style="font-family:arial,helvetica,sans-serif;">- Tomorrows supports are 243.01 and 241.24</span></span></li>
<li>
<span style="font-size:14px;"><span style="font-family:arial,helvetica,sans-serif;">- The resistant value exists at 245.14</span></span></li>
</ol>
<p>
<img alt="" src="/app/webroot/userfiles/images/mindsnepal%281%29.jpg" style="width: 300px; height: 133px;" /></p>
<p>
<strong><em>Disclaimer:</em></strong></p>
<p>
<em>The information contained herein does not purport to be comprehensive and is strictly for information purposes only. It should not be regarded as investment/trading/financial advice. All the information is believed to come from reliable sources.</em></p>
<p>
</p>
<p>
</p>
',
'published' => true,
'created' => '2019-02-05',
'modified' => '2019-02-05',
'keywords' => '',
'description' => '',
'sortorder' => '9741',
'image' => '20190205051944_nepse 21magh.jpg',
'article_date' => '2019-02-05 00:00:00',
'homepage' => true,
'breaking_news' => false,
'main_news' => false,
'in_scroller' => false,
'user_id' => '22'
),
'ArticleCategory' => array(
'id' => '1',
'name' => 'NEWS',
'parentOf' => '0',
'published' => true,
'registered' => '2015-07-20 00:00:00',
'sortorder' => '158',
'del_flag' => '0',
'homepage' => true,
'display_in_menu' => true,
'user_id' => '1',
'created' => '0000-00-00 00:00:00',
'modified' => '2018-11-22 11:58:49'
),
'User' => array(
'password' => '*****',
'id' => '22',
'user_detail_id' => '1',
'group_id' => '24',
'username' => 'kishor.bam@newbusinessage.com',
'name' => '',
'email' => 'kishor.bam@newbusinessage.com',
'address' => '',
'gender' => '',
'access' => '1',
'phone' => '',
'access_type' => '0',
'activated' => false,
'sortorder' => '0',
'published' => '0',
'created' => '2018-11-30 10:47:22',
'last_login' => '2019-06-09 10:32:40',
'ip' => '202.63.242.112'
),
'ArticleComment' => array(),
'ArticleFeature' => array(),
'ArticleHasAuthor' => array(),
'ArticleHasTag' => array(),
'ArticleView' => array(
(int) 0 => array(
[maximum depth reached]
)
),
'Slider' => array()
),
'current_user' => null,
'logged_in' => false
)
$article = array(
'Article' => array(
'id' => '9971',
'article_category_id' => '1',
'title' => 'Nepse Analysis for 6 Feb.',
'sub_title' => '',
'summary' => 'Today’s trading volume Rs 23.100 crores has been lower as compared to yesterday’s trading volume of Rs 36.436 Crores. ',
'content' => '<p>
<strong>CMP: 1147.10 NEPSE</strong></p>
<p>
<strong>The pivot table for tomorrow (23<sup>rd</sup> Magh)</strong></p>
<table align="left" border="1" cellpadding="0" cellspacing="0" style="width:658px;" width="658">
<tbody>
<tr>
<td style="width:94px;height:23px;">
<p>
<strong>S3</strong></p>
</td>
<td style="width:94px;height:23px;">
<p>
<strong>S2</strong></p>
</td>
<td style="width:94px;height:23px;">
<p>
<strong>S1</strong></p>
</td>
<td style="width:88px;height:23px;">
<p>
<strong>P</strong></p>
</td>
<td style="width:96px;height:23px;">
<p>
<strong>R1</strong></p>
</td>
<td style="width:96px;height:23px;">
<p>
<strong>R2</strong></p>
</td>
<td style="width:96px;height:23px;">
<p>
<strong>R3</strong></p>
</td>
</tr>
<tr>
<td style="width:94px;height:23px;">
<p>
1139.77</p>
</td>
<td style="width:94px;height:23px;">
<p>
1142.02</p>
</td>
<td style="width:94px;height:23px;">
<p>
1144.56</p>
</td>
<td style="width:88px;height:23px;">
<p>
<strong>1146.81</strong></p>
</td>
<td style="width:96px;height:23px;">
<p>
1149.35</p>
</td>
<td style="width:96px;height:23px;">
<p>
1151.60</p>
</td>
<td style="width:96px;height:23px;">
<p>
1154.14</p>
</td>
</tr>
</tbody>
</table>
<p>
</p>
<p>
</p>
<p>
</p>
<p>
</p>
<p>
<span style="font-size:14px;"><span style="font-family:arial,helvetica,sans-serif;">Today’s (22<sup>nd </sup>Magh) volume : Rs 23.100 crores</span></span></p>
<p>
<span style="font-size:14px;"><span style="font-family:arial,helvetica,sans-serif;">Yesterdays (21<sup>st</sup> Magh) volume : Rs 36.436 crores</span></span></p>
<p>
<span style="font-size:14px;"><span style="font-family:arial,helvetica,sans-serif;"><strong>The Trading volume:</strong></span></span></p>
<p>
<span style="font-size:14px;"><span style="font-family:arial,helvetica,sans-serif;">Today’s trading volume Rs 23.100 crores has been lower as compared to yesterday’s trading volume of Rs 36.436 Crores. The trading volume does not show a promising bullish outlook when market has closed green and above the daily pivot.</span></span></p>
<p>
<span style="font-size:14px;"><span style="font-family:arial,helvetica,sans-serif;"><strong>Commentary:</strong></span></span></p>
<ul>
<li>
<span style="font-size:14px;"><span style="font-family:arial,helvetica,sans-serif;">- Market seems finding support and has grown higher than yesterdays close.</span></span></li>
<li>
<span style="font-size:14px;"><span style="font-family:arial,helvetica,sans-serif;">- Current market price 1147.10 is higher than tomorrows pivot 1146.81; that indicates market with further growth.</span></span></li>
<li>
<span style="font-size:14px;"><span style="font-family:arial,helvetica,sans-serif;">- Today market traded in lower volume than the yesterdays.</span></span></li>
</ul>
<p>
<span style="font-size:14px;"><span style="font-family:arial,helvetica,sans-serif;"><strong>Recommendations: </strong></span></span></p>
<ul>
<li>
<span style="font-size:14px;"><span style="font-family:arial,helvetica,sans-serif;">- Market may move up if sustained over the pivot 1146.81 but the lower trading volume today keeps all the analysts and traders in the chaos.</span></span></li>
<li>
<span style="font-size:14px;"><span style="font-family:arial,helvetica,sans-serif;">- If trading volume increases with rise in Nepse value tomorrow, the market may target to the weekly pivot 1164.683 which seems virtual at this time.</span></span></li>
<li>
<span style="font-size:14px;"><span style="font-family:arial,helvetica,sans-serif;">- Still the aggressive traders may sell some of their portfolios if they get an exit point to find another support level as an entry point in near future.</span></span></li>
</ul>
<p>
<span style="font-size:14px;"><span style="font-family:arial,helvetica,sans-serif;"><strong>Fundamental Outlook:</strong></span></span></p>
<ul>
<li>
<span style="font-size:14px;"><span style="font-family:arial,helvetica,sans-serif;">- The liquidity crisis in Banks seems still persisting and this has been major factor to affect the stock market in negative prices.</span></span></li>
<li>
<span style="font-size:14px;"><span style="font-family:arial,helvetica,sans-serif;">- Government is in verge to review the half annually performances of the current fiscal year. If government shows a probability to spend on the expenditures, the liquidity problem for the short period would be eased to relax the stock market for a price growth.</span></span></li>
<li>
<span style="font-size:14px;"><span style="font-family:arial,helvetica,sans-serif;">- The brokers’ branches out of Kathmandu may not only add the number of traders but may add the value too as a positive effect on market for the price elevation.</span></span></li>
</ul>
<p>
<span style="font-family:arial,helvetica,sans-serif;">Happy Trading……..!!!!!</span></p>
<p>
<img alt="" src="/app/webroot/userfiles/images/nepse.jpg" style="width: 500px; height: 395px;" /></p>
<p>
<strong><span style="font-size:14px;"><span style="font-family:arial,helvetica,sans-serif;">Nepse Daily Candle Chart Illustrates:</span></span></strong></p>
<ol>
<li>
<span style="font-size:14px;"><span style="font-family:arial,helvetica,sans-serif;">- A small green after two consecutive red. Is it harami candle stick pattern?</span></span></li>
<li>
<span style="font-size:14px;"><span style="font-family:arial,helvetica,sans-serif;">- Market inside a triangle where support lies at 1143.9 and resistant at level 1163.02</span></span></li>
<li>
<span style="font-size:14px;"><span style="font-family:arial,helvetica,sans-serif;">- If the trading volume rises with bullish mindset of investors market may target the weekly pivot value 1162 level.</span></span></li>
<li>
<span style="font-size:14px;"><span style="font-family:arial,helvetica,sans-serif;">- If market does not show a sign of recovery then market shall break the current support level to find a new low.</span></span></li>
</ol>
<p>
<img alt="" src="/app/webroot/userfiles/images/sens.jpg" style="width: 500px; height: 419px;" /></p>
<p>
<strong><span style="font-size:14px;"><span style="font-family:arial,helvetica,sans-serif;">Sensitive index daily candle chart illustrates:</span></span></strong></p>
<ol>
<li>
<span style="font-size:14px;"><span style="font-family:arial,helvetica,sans-serif;">- Tomorrows supports are 243.01 and 241.24</span></span></li>
<li>
<span style="font-size:14px;"><span style="font-family:arial,helvetica,sans-serif;">- The resistant value exists at 245.14</span></span></li>
</ol>
<p>
<img alt="" src="/app/webroot/userfiles/images/mindsnepal%281%29.jpg" style="width: 300px; height: 133px;" /></p>
<p>
<strong><em>Disclaimer:</em></strong></p>
<p>
<em>The information contained herein does not purport to be comprehensive and is strictly for information purposes only. It should not be regarded as investment/trading/financial advice. All the information is believed to come from reliable sources.</em></p>
<p>
</p>
<p>
</p>
',
'published' => true,
'created' => '2019-02-05',
'modified' => '2019-02-05',
'keywords' => '',
'description' => '',
'sortorder' => '9741',
'image' => '20190205051944_nepse 21magh.jpg',
'article_date' => '2019-02-05 00:00:00',
'homepage' => true,
'breaking_news' => false,
'main_news' => false,
'in_scroller' => false,
'user_id' => '22'
),
'ArticleCategory' => array(
'id' => '1',
'name' => 'NEWS',
'parentOf' => '0',
'published' => true,
'registered' => '2015-07-20 00:00:00',
'sortorder' => '158',
'del_flag' => '0',
'homepage' => true,
'display_in_menu' => true,
'user_id' => '1',
'created' => '0000-00-00 00:00:00',
'modified' => '2018-11-22 11:58:49'
),
'User' => array(
'password' => '*****',
'id' => '22',
'user_detail_id' => '1',
'group_id' => '24',
'username' => 'kishor.bam@newbusinessage.com',
'name' => '',
'email' => 'kishor.bam@newbusinessage.com',
'address' => '',
'gender' => '',
'access' => '1',
'phone' => '',
'access_type' => '0',
'activated' => false,
'sortorder' => '0',
'published' => '0',
'created' => '2018-11-30 10:47:22',
'last_login' => '2019-06-09 10:32:40',
'ip' => '202.63.242.112'
),
'ArticleComment' => array(),
'ArticleFeature' => array(),
'ArticleHasAuthor' => array(),
'ArticleHasTag' => array(),
'ArticleView' => array(
(int) 0 => array(
'article_id' => '9971',
'hit' => '1048'
)
),
'Slider' => array()
)
$current_user = null
$logged_in = false
$image = 'https://www.old.newbusinessage.com/app/webroot/img/news/20190205051944_nepse 21magh.jpg'
$user = null
include - APP/View/Articles/view.ctp, line 115
View::_evaluate() - CORE/Cake/View/View.php, line 971
View::_render() - CORE/Cake/View/View.php, line 933
View::render() - CORE/Cake/View/View.php, line 473
Controller::render() - CORE/Cake/Controller/Controller.php, line 968
Dispatcher::_invoke() - CORE/Cake/Routing/Dispatcher.php, line 200
Dispatcher::dispatch() - CORE/Cake/Routing/Dispatcher.php, line 167
[main] - APP/webroot/index.php, line 117
Notice (8): Trying to access array offset on value of type null [APP/View/Articles/view.ctp, line 115]
$user = $this->Session->read('Auth.User');
//find the group of logged user
$groupId = $user['Group']['id'];
$viewFile = '/var/www/html/newbusinessage.com/app/View/Articles/view.ctp'
$dataForView = array(
'article' => array(
'Article' => array(
'id' => '9971',
'article_category_id' => '1',
'title' => 'Nepse Analysis for 6 Feb.',
'sub_title' => '',
'summary' => 'Today’s trading volume Rs 23.100 crores has been lower as compared to yesterday’s trading volume of Rs 36.436 Crores. ',
'content' => '<p>
<strong>CMP: 1147.10 NEPSE</strong></p>
<p>
<strong>The pivot table for tomorrow (23<sup>rd</sup> Magh)</strong></p>
<table align="left" border="1" cellpadding="0" cellspacing="0" style="width:658px;" width="658">
<tbody>
<tr>
<td style="width:94px;height:23px;">
<p>
<strong>S3</strong></p>
</td>
<td style="width:94px;height:23px;">
<p>
<strong>S2</strong></p>
</td>
<td style="width:94px;height:23px;">
<p>
<strong>S1</strong></p>
</td>
<td style="width:88px;height:23px;">
<p>
<strong>P</strong></p>
</td>
<td style="width:96px;height:23px;">
<p>
<strong>R1</strong></p>
</td>
<td style="width:96px;height:23px;">
<p>
<strong>R2</strong></p>
</td>
<td style="width:96px;height:23px;">
<p>
<strong>R3</strong></p>
</td>
</tr>
<tr>
<td style="width:94px;height:23px;">
<p>
1139.77</p>
</td>
<td style="width:94px;height:23px;">
<p>
1142.02</p>
</td>
<td style="width:94px;height:23px;">
<p>
1144.56</p>
</td>
<td style="width:88px;height:23px;">
<p>
<strong>1146.81</strong></p>
</td>
<td style="width:96px;height:23px;">
<p>
1149.35</p>
</td>
<td style="width:96px;height:23px;">
<p>
1151.60</p>
</td>
<td style="width:96px;height:23px;">
<p>
1154.14</p>
</td>
</tr>
</tbody>
</table>
<p>
</p>
<p>
</p>
<p>
</p>
<p>
</p>
<p>
<span style="font-size:14px;"><span style="font-family:arial,helvetica,sans-serif;">Today’s (22<sup>nd </sup>Magh) volume : Rs 23.100 crores</span></span></p>
<p>
<span style="font-size:14px;"><span style="font-family:arial,helvetica,sans-serif;">Yesterdays (21<sup>st</sup> Magh) volume : Rs 36.436 crores</span></span></p>
<p>
<span style="font-size:14px;"><span style="font-family:arial,helvetica,sans-serif;"><strong>The Trading volume:</strong></span></span></p>
<p>
<span style="font-size:14px;"><span style="font-family:arial,helvetica,sans-serif;">Today’s trading volume Rs 23.100 crores has been lower as compared to yesterday’s trading volume of Rs 36.436 Crores. The trading volume does not show a promising bullish outlook when market has closed green and above the daily pivot.</span></span></p>
<p>
<span style="font-size:14px;"><span style="font-family:arial,helvetica,sans-serif;"><strong>Commentary:</strong></span></span></p>
<ul>
<li>
<span style="font-size:14px;"><span style="font-family:arial,helvetica,sans-serif;">- Market seems finding support and has grown higher than yesterdays close.</span></span></li>
<li>
<span style="font-size:14px;"><span style="font-family:arial,helvetica,sans-serif;">- Current market price 1147.10 is higher than tomorrows pivot 1146.81; that indicates market with further growth.</span></span></li>
<li>
<span style="font-size:14px;"><span style="font-family:arial,helvetica,sans-serif;">- Today market traded in lower volume than the yesterdays.</span></span></li>
</ul>
<p>
<span style="font-size:14px;"><span style="font-family:arial,helvetica,sans-serif;"><strong>Recommendations: </strong></span></span></p>
<ul>
<li>
<span style="font-size:14px;"><span style="font-family:arial,helvetica,sans-serif;">- Market may move up if sustained over the pivot 1146.81 but the lower trading volume today keeps all the analysts and traders in the chaos.</span></span></li>
<li>
<span style="font-size:14px;"><span style="font-family:arial,helvetica,sans-serif;">- If trading volume increases with rise in Nepse value tomorrow, the market may target to the weekly pivot 1164.683 which seems virtual at this time.</span></span></li>
<li>
<span style="font-size:14px;"><span style="font-family:arial,helvetica,sans-serif;">- Still the aggressive traders may sell some of their portfolios if they get an exit point to find another support level as an entry point in near future.</span></span></li>
</ul>
<p>
<span style="font-size:14px;"><span style="font-family:arial,helvetica,sans-serif;"><strong>Fundamental Outlook:</strong></span></span></p>
<ul>
<li>
<span style="font-size:14px;"><span style="font-family:arial,helvetica,sans-serif;">- The liquidity crisis in Banks seems still persisting and this has been major factor to affect the stock market in negative prices.</span></span></li>
<li>
<span style="font-size:14px;"><span style="font-family:arial,helvetica,sans-serif;">- Government is in verge to review the half annually performances of the current fiscal year. If government shows a probability to spend on the expenditures, the liquidity problem for the short period would be eased to relax the stock market for a price growth.</span></span></li>
<li>
<span style="font-size:14px;"><span style="font-family:arial,helvetica,sans-serif;">- The brokers’ branches out of Kathmandu may not only add the number of traders but may add the value too as a positive effect on market for the price elevation.</span></span></li>
</ul>
<p>
<span style="font-family:arial,helvetica,sans-serif;">Happy Trading……..!!!!!</span></p>
<p>
<img alt="" src="/app/webroot/userfiles/images/nepse.jpg" style="width: 500px; height: 395px;" /></p>
<p>
<strong><span style="font-size:14px;"><span style="font-family:arial,helvetica,sans-serif;">Nepse Daily Candle Chart Illustrates:</span></span></strong></p>
<ol>
<li>
<span style="font-size:14px;"><span style="font-family:arial,helvetica,sans-serif;">- A small green after two consecutive red. Is it harami candle stick pattern?</span></span></li>
<li>
<span style="font-size:14px;"><span style="font-family:arial,helvetica,sans-serif;">- Market inside a triangle where support lies at 1143.9 and resistant at level 1163.02</span></span></li>
<li>
<span style="font-size:14px;"><span style="font-family:arial,helvetica,sans-serif;">- If the trading volume rises with bullish mindset of investors market may target the weekly pivot value 1162 level.</span></span></li>
<li>
<span style="font-size:14px;"><span style="font-family:arial,helvetica,sans-serif;">- If market does not show a sign of recovery then market shall break the current support level to find a new low.</span></span></li>
</ol>
<p>
<img alt="" src="/app/webroot/userfiles/images/sens.jpg" style="width: 500px; height: 419px;" /></p>
<p>
<strong><span style="font-size:14px;"><span style="font-family:arial,helvetica,sans-serif;">Sensitive index daily candle chart illustrates:</span></span></strong></p>
<ol>
<li>
<span style="font-size:14px;"><span style="font-family:arial,helvetica,sans-serif;">- Tomorrows supports are 243.01 and 241.24</span></span></li>
<li>
<span style="font-size:14px;"><span style="font-family:arial,helvetica,sans-serif;">- The resistant value exists at 245.14</span></span></li>
</ol>
<p>
<img alt="" src="/app/webroot/userfiles/images/mindsnepal%281%29.jpg" style="width: 300px; height: 133px;" /></p>
<p>
<strong><em>Disclaimer:</em></strong></p>
<p>
<em>The information contained herein does not purport to be comprehensive and is strictly for information purposes only. It should not be regarded as investment/trading/financial advice. All the information is believed to come from reliable sources.</em></p>
<p>
</p>
<p>
</p>
',
'published' => true,
'created' => '2019-02-05',
'modified' => '2019-02-05',
'keywords' => '',
'description' => '',
'sortorder' => '9741',
'image' => '20190205051944_nepse 21magh.jpg',
'article_date' => '2019-02-05 00:00:00',
'homepage' => true,
'breaking_news' => false,
'main_news' => false,
'in_scroller' => false,
'user_id' => '22'
),
'ArticleCategory' => array(
'id' => '1',
'name' => 'NEWS',
'parentOf' => '0',
'published' => true,
'registered' => '2015-07-20 00:00:00',
'sortorder' => '158',
'del_flag' => '0',
'homepage' => true,
'display_in_menu' => true,
'user_id' => '1',
'created' => '0000-00-00 00:00:00',
'modified' => '2018-11-22 11:58:49'
),
'User' => array(
'password' => '*****',
'id' => '22',
'user_detail_id' => '1',
'group_id' => '24',
'username' => 'kishor.bam@newbusinessage.com',
'name' => '',
'email' => 'kishor.bam@newbusinessage.com',
'address' => '',
'gender' => '',
'access' => '1',
'phone' => '',
'access_type' => '0',
'activated' => false,
'sortorder' => '0',
'published' => '0',
'created' => '2018-11-30 10:47:22',
'last_login' => '2019-06-09 10:32:40',
'ip' => '202.63.242.112'
),
'ArticleComment' => array(),
'ArticleFeature' => array(),
'ArticleHasAuthor' => array(),
'ArticleHasTag' => array(),
'ArticleView' => array(
(int) 0 => array(
[maximum depth reached]
)
),
'Slider' => array()
),
'current_user' => null,
'logged_in' => false
)
$article = array(
'Article' => array(
'id' => '9971',
'article_category_id' => '1',
'title' => 'Nepse Analysis for 6 Feb.',
'sub_title' => '',
'summary' => 'Today’s trading volume Rs 23.100 crores has been lower as compared to yesterday’s trading volume of Rs 36.436 Crores. ',
'content' => '<p>
<strong>CMP: 1147.10 NEPSE</strong></p>
<p>
<strong>The pivot table for tomorrow (23<sup>rd</sup> Magh)</strong></p>
<table align="left" border="1" cellpadding="0" cellspacing="0" style="width:658px;" width="658">
<tbody>
<tr>
<td style="width:94px;height:23px;">
<p>
<strong>S3</strong></p>
</td>
<td style="width:94px;height:23px;">
<p>
<strong>S2</strong></p>
</td>
<td style="width:94px;height:23px;">
<p>
<strong>S1</strong></p>
</td>
<td style="width:88px;height:23px;">
<p>
<strong>P</strong></p>
</td>
<td style="width:96px;height:23px;">
<p>
<strong>R1</strong></p>
</td>
<td style="width:96px;height:23px;">
<p>
<strong>R2</strong></p>
</td>
<td style="width:96px;height:23px;">
<p>
<strong>R3</strong></p>
</td>
</tr>
<tr>
<td style="width:94px;height:23px;">
<p>
1139.77</p>
</td>
<td style="width:94px;height:23px;">
<p>
1142.02</p>
</td>
<td style="width:94px;height:23px;">
<p>
1144.56</p>
</td>
<td style="width:88px;height:23px;">
<p>
<strong>1146.81</strong></p>
</td>
<td style="width:96px;height:23px;">
<p>
1149.35</p>
</td>
<td style="width:96px;height:23px;">
<p>
1151.60</p>
</td>
<td style="width:96px;height:23px;">
<p>
1154.14</p>
</td>
</tr>
</tbody>
</table>
<p>
</p>
<p>
</p>
<p>
</p>
<p>
</p>
<p>
<span style="font-size:14px;"><span style="font-family:arial,helvetica,sans-serif;">Today’s (22<sup>nd </sup>Magh) volume : Rs 23.100 crores</span></span></p>
<p>
<span style="font-size:14px;"><span style="font-family:arial,helvetica,sans-serif;">Yesterdays (21<sup>st</sup> Magh) volume : Rs 36.436 crores</span></span></p>
<p>
<span style="font-size:14px;"><span style="font-family:arial,helvetica,sans-serif;"><strong>The Trading volume:</strong></span></span></p>
<p>
<span style="font-size:14px;"><span style="font-family:arial,helvetica,sans-serif;">Today’s trading volume Rs 23.100 crores has been lower as compared to yesterday’s trading volume of Rs 36.436 Crores. The trading volume does not show a promising bullish outlook when market has closed green and above the daily pivot.</span></span></p>
<p>
<span style="font-size:14px;"><span style="font-family:arial,helvetica,sans-serif;"><strong>Commentary:</strong></span></span></p>
<ul>
<li>
<span style="font-size:14px;"><span style="font-family:arial,helvetica,sans-serif;">- Market seems finding support and has grown higher than yesterdays close.</span></span></li>
<li>
<span style="font-size:14px;"><span style="font-family:arial,helvetica,sans-serif;">- Current market price 1147.10 is higher than tomorrows pivot 1146.81; that indicates market with further growth.</span></span></li>
<li>
<span style="font-size:14px;"><span style="font-family:arial,helvetica,sans-serif;">- Today market traded in lower volume than the yesterdays.</span></span></li>
</ul>
<p>
<span style="font-size:14px;"><span style="font-family:arial,helvetica,sans-serif;"><strong>Recommendations: </strong></span></span></p>
<ul>
<li>
<span style="font-size:14px;"><span style="font-family:arial,helvetica,sans-serif;">- Market may move up if sustained over the pivot 1146.81 but the lower trading volume today keeps all the analysts and traders in the chaos.</span></span></li>
<li>
<span style="font-size:14px;"><span style="font-family:arial,helvetica,sans-serif;">- If trading volume increases with rise in Nepse value tomorrow, the market may target to the weekly pivot 1164.683 which seems virtual at this time.</span></span></li>
<li>
<span style="font-size:14px;"><span style="font-family:arial,helvetica,sans-serif;">- Still the aggressive traders may sell some of their portfolios if they get an exit point to find another support level as an entry point in near future.</span></span></li>
</ul>
<p>
<span style="font-size:14px;"><span style="font-family:arial,helvetica,sans-serif;"><strong>Fundamental Outlook:</strong></span></span></p>
<ul>
<li>
<span style="font-size:14px;"><span style="font-family:arial,helvetica,sans-serif;">- The liquidity crisis in Banks seems still persisting and this has been major factor to affect the stock market in negative prices.</span></span></li>
<li>
<span style="font-size:14px;"><span style="font-family:arial,helvetica,sans-serif;">- Government is in verge to review the half annually performances of the current fiscal year. If government shows a probability to spend on the expenditures, the liquidity problem for the short period would be eased to relax the stock market for a price growth.</span></span></li>
<li>
<span style="font-size:14px;"><span style="font-family:arial,helvetica,sans-serif;">- The brokers’ branches out of Kathmandu may not only add the number of traders but may add the value too as a positive effect on market for the price elevation.</span></span></li>
</ul>
<p>
<span style="font-family:arial,helvetica,sans-serif;">Happy Trading……..!!!!!</span></p>
<p>
<img alt="" src="/app/webroot/userfiles/images/nepse.jpg" style="width: 500px; height: 395px;" /></p>
<p>
<strong><span style="font-size:14px;"><span style="font-family:arial,helvetica,sans-serif;">Nepse Daily Candle Chart Illustrates:</span></span></strong></p>
<ol>
<li>
<span style="font-size:14px;"><span style="font-family:arial,helvetica,sans-serif;">- A small green after two consecutive red. Is it harami candle stick pattern?</span></span></li>
<li>
<span style="font-size:14px;"><span style="font-family:arial,helvetica,sans-serif;">- Market inside a triangle where support lies at 1143.9 and resistant at level 1163.02</span></span></li>
<li>
<span style="font-size:14px;"><span style="font-family:arial,helvetica,sans-serif;">- If the trading volume rises with bullish mindset of investors market may target the weekly pivot value 1162 level.</span></span></li>
<li>
<span style="font-size:14px;"><span style="font-family:arial,helvetica,sans-serif;">- If market does not show a sign of recovery then market shall break the current support level to find a new low.</span></span></li>
</ol>
<p>
<img alt="" src="/app/webroot/userfiles/images/sens.jpg" style="width: 500px; height: 419px;" /></p>
<p>
<strong><span style="font-size:14px;"><span style="font-family:arial,helvetica,sans-serif;">Sensitive index daily candle chart illustrates:</span></span></strong></p>
<ol>
<li>
<span style="font-size:14px;"><span style="font-family:arial,helvetica,sans-serif;">- Tomorrows supports are 243.01 and 241.24</span></span></li>
<li>
<span style="font-size:14px;"><span style="font-family:arial,helvetica,sans-serif;">- The resistant value exists at 245.14</span></span></li>
</ol>
<p>
<img alt="" src="/app/webroot/userfiles/images/mindsnepal%281%29.jpg" style="width: 300px; height: 133px;" /></p>
<p>
<strong><em>Disclaimer:</em></strong></p>
<p>
<em>The information contained herein does not purport to be comprehensive and is strictly for information purposes only. It should not be regarded as investment/trading/financial advice. All the information is believed to come from reliable sources.</em></p>
<p>
</p>
<p>
</p>
',
'published' => true,
'created' => '2019-02-05',
'modified' => '2019-02-05',
'keywords' => '',
'description' => '',
'sortorder' => '9741',
'image' => '20190205051944_nepse 21magh.jpg',
'article_date' => '2019-02-05 00:00:00',
'homepage' => true,
'breaking_news' => false,
'main_news' => false,
'in_scroller' => false,
'user_id' => '22'
),
'ArticleCategory' => array(
'id' => '1',
'name' => 'NEWS',
'parentOf' => '0',
'published' => true,
'registered' => '2015-07-20 00:00:00',
'sortorder' => '158',
'del_flag' => '0',
'homepage' => true,
'display_in_menu' => true,
'user_id' => '1',
'created' => '0000-00-00 00:00:00',
'modified' => '2018-11-22 11:58:49'
),
'User' => array(
'password' => '*****',
'id' => '22',
'user_detail_id' => '1',
'group_id' => '24',
'username' => 'kishor.bam@newbusinessage.com',
'name' => '',
'email' => 'kishor.bam@newbusinessage.com',
'address' => '',
'gender' => '',
'access' => '1',
'phone' => '',
'access_type' => '0',
'activated' => false,
'sortorder' => '0',
'published' => '0',
'created' => '2018-11-30 10:47:22',
'last_login' => '2019-06-09 10:32:40',
'ip' => '202.63.242.112'
),
'ArticleComment' => array(),
'ArticleFeature' => array(),
'ArticleHasAuthor' => array(),
'ArticleHasTag' => array(),
'ArticleView' => array(
(int) 0 => array(
'article_id' => '9971',
'hit' => '1048'
)
),
'Slider' => array()
)
$current_user = null
$logged_in = false
$image = 'https://www.old.newbusinessage.com/app/webroot/img/news/20190205051944_nepse 21magh.jpg'
$user = null
include - APP/View/Articles/view.ctp, line 115
View::_evaluate() - CORE/Cake/View/View.php, line 971
View::_render() - CORE/Cake/View/View.php, line 933
View::render() - CORE/Cake/View/View.php, line 473
Controller::render() - CORE/Cake/Controller/Controller.php, line 968
Dispatcher::_invoke() - CORE/Cake/Routing/Dispatcher.php, line 200
Dispatcher::dispatch() - CORE/Cake/Routing/Dispatcher.php, line 167
[main] - APP/webroot/index.php, line 117
Notice (8): Trying to access array offset on value of type null [APP/View/Articles/view.ctp, line 116]
//find the group of logged user
$groupId = $user['Group']['id'];
$user_id=$user["id"];
$viewFile = '/var/www/html/newbusinessage.com/app/View/Articles/view.ctp'
$dataForView = array(
'article' => array(
'Article' => array(
'id' => '9971',
'article_category_id' => '1',
'title' => 'Nepse Analysis for 6 Feb.',
'sub_title' => '',
'summary' => 'Today’s trading volume Rs 23.100 crores has been lower as compared to yesterday’s trading volume of Rs 36.436 Crores. ',
'content' => '<p>
<strong>CMP: 1147.10 NEPSE</strong></p>
<p>
<strong>The pivot table for tomorrow (23<sup>rd</sup> Magh)</strong></p>
<table align="left" border="1" cellpadding="0" cellspacing="0" style="width:658px;" width="658">
<tbody>
<tr>
<td style="width:94px;height:23px;">
<p>
<strong>S3</strong></p>
</td>
<td style="width:94px;height:23px;">
<p>
<strong>S2</strong></p>
</td>
<td style="width:94px;height:23px;">
<p>
<strong>S1</strong></p>
</td>
<td style="width:88px;height:23px;">
<p>
<strong>P</strong></p>
</td>
<td style="width:96px;height:23px;">
<p>
<strong>R1</strong></p>
</td>
<td style="width:96px;height:23px;">
<p>
<strong>R2</strong></p>
</td>
<td style="width:96px;height:23px;">
<p>
<strong>R3</strong></p>
</td>
</tr>
<tr>
<td style="width:94px;height:23px;">
<p>
1139.77</p>
</td>
<td style="width:94px;height:23px;">
<p>
1142.02</p>
</td>
<td style="width:94px;height:23px;">
<p>
1144.56</p>
</td>
<td style="width:88px;height:23px;">
<p>
<strong>1146.81</strong></p>
</td>
<td style="width:96px;height:23px;">
<p>
1149.35</p>
</td>
<td style="width:96px;height:23px;">
<p>
1151.60</p>
</td>
<td style="width:96px;height:23px;">
<p>
1154.14</p>
</td>
</tr>
</tbody>
</table>
<p>
</p>
<p>
</p>
<p>
</p>
<p>
</p>
<p>
<span style="font-size:14px;"><span style="font-family:arial,helvetica,sans-serif;">Today’s (22<sup>nd </sup>Magh) volume : Rs 23.100 crores</span></span></p>
<p>
<span style="font-size:14px;"><span style="font-family:arial,helvetica,sans-serif;">Yesterdays (21<sup>st</sup> Magh) volume : Rs 36.436 crores</span></span></p>
<p>
<span style="font-size:14px;"><span style="font-family:arial,helvetica,sans-serif;"><strong>The Trading volume:</strong></span></span></p>
<p>
<span style="font-size:14px;"><span style="font-family:arial,helvetica,sans-serif;">Today’s trading volume Rs 23.100 crores has been lower as compared to yesterday’s trading volume of Rs 36.436 Crores. The trading volume does not show a promising bullish outlook when market has closed green and above the daily pivot.</span></span></p>
<p>
<span style="font-size:14px;"><span style="font-family:arial,helvetica,sans-serif;"><strong>Commentary:</strong></span></span></p>
<ul>
<li>
<span style="font-size:14px;"><span style="font-family:arial,helvetica,sans-serif;">- Market seems finding support and has grown higher than yesterdays close.</span></span></li>
<li>
<span style="font-size:14px;"><span style="font-family:arial,helvetica,sans-serif;">- Current market price 1147.10 is higher than tomorrows pivot 1146.81; that indicates market with further growth.</span></span></li>
<li>
<span style="font-size:14px;"><span style="font-family:arial,helvetica,sans-serif;">- Today market traded in lower volume than the yesterdays.</span></span></li>
</ul>
<p>
<span style="font-size:14px;"><span style="font-family:arial,helvetica,sans-serif;"><strong>Recommendations: </strong></span></span></p>
<ul>
<li>
<span style="font-size:14px;"><span style="font-family:arial,helvetica,sans-serif;">- Market may move up if sustained over the pivot 1146.81 but the lower trading volume today keeps all the analysts and traders in the chaos.</span></span></li>
<li>
<span style="font-size:14px;"><span style="font-family:arial,helvetica,sans-serif;">- If trading volume increases with rise in Nepse value tomorrow, the market may target to the weekly pivot 1164.683 which seems virtual at this time.</span></span></li>
<li>
<span style="font-size:14px;"><span style="font-family:arial,helvetica,sans-serif;">- Still the aggressive traders may sell some of their portfolios if they get an exit point to find another support level as an entry point in near future.</span></span></li>
</ul>
<p>
<span style="font-size:14px;"><span style="font-family:arial,helvetica,sans-serif;"><strong>Fundamental Outlook:</strong></span></span></p>
<ul>
<li>
<span style="font-size:14px;"><span style="font-family:arial,helvetica,sans-serif;">- The liquidity crisis in Banks seems still persisting and this has been major factor to affect the stock market in negative prices.</span></span></li>
<li>
<span style="font-size:14px;"><span style="font-family:arial,helvetica,sans-serif;">- Government is in verge to review the half annually performances of the current fiscal year. If government shows a probability to spend on the expenditures, the liquidity problem for the short period would be eased to relax the stock market for a price growth.</span></span></li>
<li>
<span style="font-size:14px;"><span style="font-family:arial,helvetica,sans-serif;">- The brokers’ branches out of Kathmandu may not only add the number of traders but may add the value too as a positive effect on market for the price elevation.</span></span></li>
</ul>
<p>
<span style="font-family:arial,helvetica,sans-serif;">Happy Trading……..!!!!!</span></p>
<p>
<img alt="" src="/app/webroot/userfiles/images/nepse.jpg" style="width: 500px; height: 395px;" /></p>
<p>
<strong><span style="font-size:14px;"><span style="font-family:arial,helvetica,sans-serif;">Nepse Daily Candle Chart Illustrates:</span></span></strong></p>
<ol>
<li>
<span style="font-size:14px;"><span style="font-family:arial,helvetica,sans-serif;">- A small green after two consecutive red. Is it harami candle stick pattern?</span></span></li>
<li>
<span style="font-size:14px;"><span style="font-family:arial,helvetica,sans-serif;">- Market inside a triangle where support lies at 1143.9 and resistant at level 1163.02</span></span></li>
<li>
<span style="font-size:14px;"><span style="font-family:arial,helvetica,sans-serif;">- If the trading volume rises with bullish mindset of investors market may target the weekly pivot value 1162 level.</span></span></li>
<li>
<span style="font-size:14px;"><span style="font-family:arial,helvetica,sans-serif;">- If market does not show a sign of recovery then market shall break the current support level to find a new low.</span></span></li>
</ol>
<p>
<img alt="" src="/app/webroot/userfiles/images/sens.jpg" style="width: 500px; height: 419px;" /></p>
<p>
<strong><span style="font-size:14px;"><span style="font-family:arial,helvetica,sans-serif;">Sensitive index daily candle chart illustrates:</span></span></strong></p>
<ol>
<li>
<span style="font-size:14px;"><span style="font-family:arial,helvetica,sans-serif;">- Tomorrows supports are 243.01 and 241.24</span></span></li>
<li>
<span style="font-size:14px;"><span style="font-family:arial,helvetica,sans-serif;">- The resistant value exists at 245.14</span></span></li>
</ol>
<p>
<img alt="" src="/app/webroot/userfiles/images/mindsnepal%281%29.jpg" style="width: 300px; height: 133px;" /></p>
<p>
<strong><em>Disclaimer:</em></strong></p>
<p>
<em>The information contained herein does not purport to be comprehensive and is strictly for information purposes only. It should not be regarded as investment/trading/financial advice. All the information is believed to come from reliable sources.</em></p>
<p>
</p>
<p>
</p>
',
'published' => true,
'created' => '2019-02-05',
'modified' => '2019-02-05',
'keywords' => '',
'description' => '',
'sortorder' => '9741',
'image' => '20190205051944_nepse 21magh.jpg',
'article_date' => '2019-02-05 00:00:00',
'homepage' => true,
'breaking_news' => false,
'main_news' => false,
'in_scroller' => false,
'user_id' => '22'
),
'ArticleCategory' => array(
'id' => '1',
'name' => 'NEWS',
'parentOf' => '0',
'published' => true,
'registered' => '2015-07-20 00:00:00',
'sortorder' => '158',
'del_flag' => '0',
'homepage' => true,
'display_in_menu' => true,
'user_id' => '1',
'created' => '0000-00-00 00:00:00',
'modified' => '2018-11-22 11:58:49'
),
'User' => array(
'password' => '*****',
'id' => '22',
'user_detail_id' => '1',
'group_id' => '24',
'username' => 'kishor.bam@newbusinessage.com',
'name' => '',
'email' => 'kishor.bam@newbusinessage.com',
'address' => '',
'gender' => '',
'access' => '1',
'phone' => '',
'access_type' => '0',
'activated' => false,
'sortorder' => '0',
'published' => '0',
'created' => '2018-11-30 10:47:22',
'last_login' => '2019-06-09 10:32:40',
'ip' => '202.63.242.112'
),
'ArticleComment' => array(),
'ArticleFeature' => array(),
'ArticleHasAuthor' => array(),
'ArticleHasTag' => array(),
'ArticleView' => array(
(int) 0 => array(
[maximum depth reached]
)
),
'Slider' => array()
),
'current_user' => null,
'logged_in' => false
)
$article = array(
'Article' => array(
'id' => '9971',
'article_category_id' => '1',
'title' => 'Nepse Analysis for 6 Feb.',
'sub_title' => '',
'summary' => 'Today’s trading volume Rs 23.100 crores has been lower as compared to yesterday’s trading volume of Rs 36.436 Crores. ',
'content' => '<p>
<strong>CMP: 1147.10 NEPSE</strong></p>
<p>
<strong>The pivot table for tomorrow (23<sup>rd</sup> Magh)</strong></p>
<table align="left" border="1" cellpadding="0" cellspacing="0" style="width:658px;" width="658">
<tbody>
<tr>
<td style="width:94px;height:23px;">
<p>
<strong>S3</strong></p>
</td>
<td style="width:94px;height:23px;">
<p>
<strong>S2</strong></p>
</td>
<td style="width:94px;height:23px;">
<p>
<strong>S1</strong></p>
</td>
<td style="width:88px;height:23px;">
<p>
<strong>P</strong></p>
</td>
<td style="width:96px;height:23px;">
<p>
<strong>R1</strong></p>
</td>
<td style="width:96px;height:23px;">
<p>
<strong>R2</strong></p>
</td>
<td style="width:96px;height:23px;">
<p>
<strong>R3</strong></p>
</td>
</tr>
<tr>
<td style="width:94px;height:23px;">
<p>
1139.77</p>
</td>
<td style="width:94px;height:23px;">
<p>
1142.02</p>
</td>
<td style="width:94px;height:23px;">
<p>
1144.56</p>
</td>
<td style="width:88px;height:23px;">
<p>
<strong>1146.81</strong></p>
</td>
<td style="width:96px;height:23px;">
<p>
1149.35</p>
</td>
<td style="width:96px;height:23px;">
<p>
1151.60</p>
</td>
<td style="width:96px;height:23px;">
<p>
1154.14</p>
</td>
</tr>
</tbody>
</table>
<p>
</p>
<p>
</p>
<p>
</p>
<p>
</p>
<p>
<span style="font-size:14px;"><span style="font-family:arial,helvetica,sans-serif;">Today’s (22<sup>nd </sup>Magh) volume : Rs 23.100 crores</span></span></p>
<p>
<span style="font-size:14px;"><span style="font-family:arial,helvetica,sans-serif;">Yesterdays (21<sup>st</sup> Magh) volume : Rs 36.436 crores</span></span></p>
<p>
<span style="font-size:14px;"><span style="font-family:arial,helvetica,sans-serif;"><strong>The Trading volume:</strong></span></span></p>
<p>
<span style="font-size:14px;"><span style="font-family:arial,helvetica,sans-serif;">Today’s trading volume Rs 23.100 crores has been lower as compared to yesterday’s trading volume of Rs 36.436 Crores. The trading volume does not show a promising bullish outlook when market has closed green and above the daily pivot.</span></span></p>
<p>
<span style="font-size:14px;"><span style="font-family:arial,helvetica,sans-serif;"><strong>Commentary:</strong></span></span></p>
<ul>
<li>
<span style="font-size:14px;"><span style="font-family:arial,helvetica,sans-serif;">- Market seems finding support and has grown higher than yesterdays close.</span></span></li>
<li>
<span style="font-size:14px;"><span style="font-family:arial,helvetica,sans-serif;">- Current market price 1147.10 is higher than tomorrows pivot 1146.81; that indicates market with further growth.</span></span></li>
<li>
<span style="font-size:14px;"><span style="font-family:arial,helvetica,sans-serif;">- Today market traded in lower volume than the yesterdays.</span></span></li>
</ul>
<p>
<span style="font-size:14px;"><span style="font-family:arial,helvetica,sans-serif;"><strong>Recommendations: </strong></span></span></p>
<ul>
<li>
<span style="font-size:14px;"><span style="font-family:arial,helvetica,sans-serif;">- Market may move up if sustained over the pivot 1146.81 but the lower trading volume today keeps all the analysts and traders in the chaos.</span></span></li>
<li>
<span style="font-size:14px;"><span style="font-family:arial,helvetica,sans-serif;">- If trading volume increases with rise in Nepse value tomorrow, the market may target to the weekly pivot 1164.683 which seems virtual at this time.</span></span></li>
<li>
<span style="font-size:14px;"><span style="font-family:arial,helvetica,sans-serif;">- Still the aggressive traders may sell some of their portfolios if they get an exit point to find another support level as an entry point in near future.</span></span></li>
</ul>
<p>
<span style="font-size:14px;"><span style="font-family:arial,helvetica,sans-serif;"><strong>Fundamental Outlook:</strong></span></span></p>
<ul>
<li>
<span style="font-size:14px;"><span style="font-family:arial,helvetica,sans-serif;">- The liquidity crisis in Banks seems still persisting and this has been major factor to affect the stock market in negative prices.</span></span></li>
<li>
<span style="font-size:14px;"><span style="font-family:arial,helvetica,sans-serif;">- Government is in verge to review the half annually performances of the current fiscal year. If government shows a probability to spend on the expenditures, the liquidity problem for the short period would be eased to relax the stock market for a price growth.</span></span></li>
<li>
<span style="font-size:14px;"><span style="font-family:arial,helvetica,sans-serif;">- The brokers’ branches out of Kathmandu may not only add the number of traders but may add the value too as a positive effect on market for the price elevation.</span></span></li>
</ul>
<p>
<span style="font-family:arial,helvetica,sans-serif;">Happy Trading……..!!!!!</span></p>
<p>
<img alt="" src="/app/webroot/userfiles/images/nepse.jpg" style="width: 500px; height: 395px;" /></p>
<p>
<strong><span style="font-size:14px;"><span style="font-family:arial,helvetica,sans-serif;">Nepse Daily Candle Chart Illustrates:</span></span></strong></p>
<ol>
<li>
<span style="font-size:14px;"><span style="font-family:arial,helvetica,sans-serif;">- A small green after two consecutive red. Is it harami candle stick pattern?</span></span></li>
<li>
<span style="font-size:14px;"><span style="font-family:arial,helvetica,sans-serif;">- Market inside a triangle where support lies at 1143.9 and resistant at level 1163.02</span></span></li>
<li>
<span style="font-size:14px;"><span style="font-family:arial,helvetica,sans-serif;">- If the trading volume rises with bullish mindset of investors market may target the weekly pivot value 1162 level.</span></span></li>
<li>
<span style="font-size:14px;"><span style="font-family:arial,helvetica,sans-serif;">- If market does not show a sign of recovery then market shall break the current support level to find a new low.</span></span></li>
</ol>
<p>
<img alt="" src="/app/webroot/userfiles/images/sens.jpg" style="width: 500px; height: 419px;" /></p>
<p>
<strong><span style="font-size:14px;"><span style="font-family:arial,helvetica,sans-serif;">Sensitive index daily candle chart illustrates:</span></span></strong></p>
<ol>
<li>
<span style="font-size:14px;"><span style="font-family:arial,helvetica,sans-serif;">- Tomorrows supports are 243.01 and 241.24</span></span></li>
<li>
<span style="font-size:14px;"><span style="font-family:arial,helvetica,sans-serif;">- The resistant value exists at 245.14</span></span></li>
</ol>
<p>
<img alt="" src="/app/webroot/userfiles/images/mindsnepal%281%29.jpg" style="width: 300px; height: 133px;" /></p>
<p>
<strong><em>Disclaimer:</em></strong></p>
<p>
<em>The information contained herein does not purport to be comprehensive and is strictly for information purposes only. It should not be regarded as investment/trading/financial advice. All the information is believed to come from reliable sources.</em></p>
<p>
</p>
<p>
</p>
',
'published' => true,
'created' => '2019-02-05',
'modified' => '2019-02-05',
'keywords' => '',
'description' => '',
'sortorder' => '9741',
'image' => '20190205051944_nepse 21magh.jpg',
'article_date' => '2019-02-05 00:00:00',
'homepage' => true,
'breaking_news' => false,
'main_news' => false,
'in_scroller' => false,
'user_id' => '22'
),
'ArticleCategory' => array(
'id' => '1',
'name' => 'NEWS',
'parentOf' => '0',
'published' => true,
'registered' => '2015-07-20 00:00:00',
'sortorder' => '158',
'del_flag' => '0',
'homepage' => true,
'display_in_menu' => true,
'user_id' => '1',
'created' => '0000-00-00 00:00:00',
'modified' => '2018-11-22 11:58:49'
),
'User' => array(
'password' => '*****',
'id' => '22',
'user_detail_id' => '1',
'group_id' => '24',
'username' => 'kishor.bam@newbusinessage.com',
'name' => '',
'email' => 'kishor.bam@newbusinessage.com',
'address' => '',
'gender' => '',
'access' => '1',
'phone' => '',
'access_type' => '0',
'activated' => false,
'sortorder' => '0',
'published' => '0',
'created' => '2018-11-30 10:47:22',
'last_login' => '2019-06-09 10:32:40',
'ip' => '202.63.242.112'
),
'ArticleComment' => array(),
'ArticleFeature' => array(),
'ArticleHasAuthor' => array(),
'ArticleHasTag' => array(),
'ArticleView' => array(
(int) 0 => array(
'article_id' => '9971',
'hit' => '1048'
)
),
'Slider' => array()
)
$current_user = null
$logged_in = false
$image = 'https://www.old.newbusinessage.com/app/webroot/img/news/20190205051944_nepse 21magh.jpg'
$user = null
$groupId = null
include - APP/View/Articles/view.ctp, line 116
View::_evaluate() - CORE/Cake/View/View.php, line 971
View::_render() - CORE/Cake/View/View.php, line 933
View::render() - CORE/Cake/View/View.php, line 473
Controller::render() - CORE/Cake/Controller/Controller.php, line 968
Dispatcher::_invoke() - CORE/Cake/Routing/Dispatcher.php, line 200
Dispatcher::dispatch() - CORE/Cake/Routing/Dispatcher.php, line 167
[main] - APP/webroot/index.php, line 117
$viewFile = '/var/www/html/newbusinessage.com/app/View/Articles/view.ctp'
$dataForView = array(
'article' => array(
'Article' => array(
'id' => '9971',
'article_category_id' => '1',
'title' => 'Nepse Analysis for 6 Feb.',
'sub_title' => '',
'summary' => 'Today’s trading volume Rs 23.100 crores has been lower as compared to yesterday’s trading volume of Rs 36.436 Crores. ',
'content' => '<p>
<strong>CMP: 1147.10 NEPSE</strong></p>
<p>
<strong>The pivot table for tomorrow (23<sup>rd</sup> Magh)</strong></p>
<table align="left" border="1" cellpadding="0" cellspacing="0" style="width:658px;" width="658">
<tbody>
<tr>
<td style="width:94px;height:23px;">
<p>
<strong>S3</strong></p>
</td>
<td style="width:94px;height:23px;">
<p>
<strong>S2</strong></p>
</td>
<td style="width:94px;height:23px;">
<p>
<strong>S1</strong></p>
</td>
<td style="width:88px;height:23px;">
<p>
<strong>P</strong></p>
</td>
<td style="width:96px;height:23px;">
<p>
<strong>R1</strong></p>
</td>
<td style="width:96px;height:23px;">
<p>
<strong>R2</strong></p>
</td>
<td style="width:96px;height:23px;">
<p>
<strong>R3</strong></p>
</td>
</tr>
<tr>
<td style="width:94px;height:23px;">
<p>
1139.77</p>
</td>
<td style="width:94px;height:23px;">
<p>
1142.02</p>
</td>
<td style="width:94px;height:23px;">
<p>
1144.56</p>
</td>
<td style="width:88px;height:23px;">
<p>
<strong>1146.81</strong></p>
</td>
<td style="width:96px;height:23px;">
<p>
1149.35</p>
</td>
<td style="width:96px;height:23px;">
<p>
1151.60</p>
</td>
<td style="width:96px;height:23px;">
<p>
1154.14</p>
</td>
</tr>
</tbody>
</table>
<p>
</p>
<p>
</p>
<p>
</p>
<p>
</p>
<p>
<span style="font-size:14px;"><span style="font-family:arial,helvetica,sans-serif;">Today’s (22<sup>nd </sup>Magh) volume : Rs 23.100 crores</span></span></p>
<p>
<span style="font-size:14px;"><span style="font-family:arial,helvetica,sans-serif;">Yesterdays (21<sup>st</sup> Magh) volume : Rs 36.436 crores</span></span></p>
<p>
<span style="font-size:14px;"><span style="font-family:arial,helvetica,sans-serif;"><strong>The Trading volume:</strong></span></span></p>
<p>
<span style="font-size:14px;"><span style="font-family:arial,helvetica,sans-serif;">Today’s trading volume Rs 23.100 crores has been lower as compared to yesterday’s trading volume of Rs 36.436 Crores. The trading volume does not show a promising bullish outlook when market has closed green and above the daily pivot.</span></span></p>
<p>
<span style="font-size:14px;"><span style="font-family:arial,helvetica,sans-serif;"><strong>Commentary:</strong></span></span></p>
<ul>
<li>
<span style="font-size:14px;"><span style="font-family:arial,helvetica,sans-serif;">- Market seems finding support and has grown higher than yesterdays close.</span></span></li>
<li>
<span style="font-size:14px;"><span style="font-family:arial,helvetica,sans-serif;">- Current market price 1147.10 is higher than tomorrows pivot 1146.81; that indicates market with further growth.</span></span></li>
<li>
<span style="font-size:14px;"><span style="font-family:arial,helvetica,sans-serif;">- Today market traded in lower volume than the yesterdays.</span></span></li>
</ul>
<p>
<span style="font-size:14px;"><span style="font-family:arial,helvetica,sans-serif;"><strong>Recommendations: </strong></span></span></p>
<ul>
<li>
<span style="font-size:14px;"><span style="font-family:arial,helvetica,sans-serif;">- Market may move up if sustained over the pivot 1146.81 but the lower trading volume today keeps all the analysts and traders in the chaos.</span></span></li>
<li>
<span style="font-size:14px;"><span style="font-family:arial,helvetica,sans-serif;">- If trading volume increases with rise in Nepse value tomorrow, the market may target to the weekly pivot 1164.683 which seems virtual at this time.</span></span></li>
<li>
<span style="font-size:14px;"><span style="font-family:arial,helvetica,sans-serif;">- Still the aggressive traders may sell some of their portfolios if they get an exit point to find another support level as an entry point in near future.</span></span></li>
</ul>
<p>
<span style="font-size:14px;"><span style="font-family:arial,helvetica,sans-serif;"><strong>Fundamental Outlook:</strong></span></span></p>
<ul>
<li>
<span style="font-size:14px;"><span style="font-family:arial,helvetica,sans-serif;">- The liquidity crisis in Banks seems still persisting and this has been major factor to affect the stock market in negative prices.</span></span></li>
<li>
<span style="font-size:14px;"><span style="font-family:arial,helvetica,sans-serif;">- Government is in verge to review the half annually performances of the current fiscal year. If government shows a probability to spend on the expenditures, the liquidity problem for the short period would be eased to relax the stock market for a price growth.</span></span></li>
<li>
<span style="font-size:14px;"><span style="font-family:arial,helvetica,sans-serif;">- The brokers’ branches out of Kathmandu may not only add the number of traders but may add the value too as a positive effect on market for the price elevation.</span></span></li>
</ul>
<p>
<span style="font-family:arial,helvetica,sans-serif;">Happy Trading……..!!!!!</span></p>
<p>
<img alt="" src="/app/webroot/userfiles/images/nepse.jpg" style="width: 500px; height: 395px;" /></p>
<p>
<strong><span style="font-size:14px;"><span style="font-family:arial,helvetica,sans-serif;">Nepse Daily Candle Chart Illustrates:</span></span></strong></p>
<ol>
<li>
<span style="font-size:14px;"><span style="font-family:arial,helvetica,sans-serif;">- A small green after two consecutive red. Is it harami candle stick pattern?</span></span></li>
<li>
<span style="font-size:14px;"><span style="font-family:arial,helvetica,sans-serif;">- Market inside a triangle where support lies at 1143.9 and resistant at level 1163.02</span></span></li>
<li>
<span style="font-size:14px;"><span style="font-family:arial,helvetica,sans-serif;">- If the trading volume rises with bullish mindset of investors market may target the weekly pivot value 1162 level.</span></span></li>
<li>
<span style="font-size:14px;"><span style="font-family:arial,helvetica,sans-serif;">- If market does not show a sign of recovery then market shall break the current support level to find a new low.</span></span></li>
</ol>
<p>
<img alt="" src="/app/webroot/userfiles/images/sens.jpg" style="width: 500px; height: 419px;" /></p>
<p>
<strong><span style="font-size:14px;"><span style="font-family:arial,helvetica,sans-serif;">Sensitive index daily candle chart illustrates:</span></span></strong></p>
<ol>
<li>
<span style="font-size:14px;"><span style="font-family:arial,helvetica,sans-serif;">- Tomorrows supports are 243.01 and 241.24</span></span></li>
<li>
<span style="font-size:14px;"><span style="font-family:arial,helvetica,sans-serif;">- The resistant value exists at 245.14</span></span></li>
</ol>
<p>
<img alt="" src="/app/webroot/userfiles/images/mindsnepal%281%29.jpg" style="width: 300px; height: 133px;" /></p>
<p>
<strong><em>Disclaimer:</em></strong></p>
<p>
<em>The information contained herein does not purport to be comprehensive and is strictly for information purposes only. It should not be regarded as investment/trading/financial advice. All the information is believed to come from reliable sources.</em></p>
<p>
</p>
<p>
</p>
',
'published' => true,
'created' => '2019-02-05',
'modified' => '2019-02-05',
'keywords' => '',
'description' => '',
'sortorder' => '9741',
'image' => '20190205051944_nepse 21magh.jpg',
'article_date' => '2019-02-05 00:00:00',
'homepage' => true,
'breaking_news' => false,
'main_news' => false,
'in_scroller' => false,
'user_id' => '22'
),
'ArticleCategory' => array(
'id' => '1',
'name' => 'NEWS',
'parentOf' => '0',
'published' => true,
'registered' => '2015-07-20 00:00:00',
'sortorder' => '158',
'del_flag' => '0',
'homepage' => true,
'display_in_menu' => true,
'user_id' => '1',
'created' => '0000-00-00 00:00:00',
'modified' => '2018-11-22 11:58:49'
),
'User' => array(
'password' => '*****',
'id' => '22',
'user_detail_id' => '1',
'group_id' => '24',
'username' => 'kishor.bam@newbusinessage.com',
'name' => '',
'email' => 'kishor.bam@newbusinessage.com',
'address' => '',
'gender' => '',
'access' => '1',
'phone' => '',
'access_type' => '0',
'activated' => false,
'sortorder' => '0',
'published' => '0',
'created' => '2018-11-30 10:47:22',
'last_login' => '2019-06-09 10:32:40',
'ip' => '202.63.242.112'
),
'ArticleComment' => array(),
'ArticleFeature' => array(),
'ArticleHasAuthor' => array(),
'ArticleHasTag' => array(),
'ArticleView' => array(
(int) 0 => array(
[maximum depth reached]
)
),
'Slider' => array()
),
'current_user' => null,
'logged_in' => false
)
$article = array(
'Article' => array(
'id' => '9971',
'article_category_id' => '1',
'title' => 'Nepse Analysis for 6 Feb.',
'sub_title' => '',
'summary' => 'Today’s trading volume Rs 23.100 crores has been lower as compared to yesterday’s trading volume of Rs 36.436 Crores. ',
'content' => '<p>
<strong>CMP: 1147.10 NEPSE</strong></p>
<p>
<strong>The pivot table for tomorrow (23<sup>rd</sup> Magh)</strong></p>
<table align="left" border="1" cellpadding="0" cellspacing="0" style="width:658px;" width="658">
<tbody>
<tr>
<td style="width:94px;height:23px;">
<p>
<strong>S3</strong></p>
</td>
<td style="width:94px;height:23px;">
<p>
<strong>S2</strong></p>
</td>
<td style="width:94px;height:23px;">
<p>
<strong>S1</strong></p>
</td>
<td style="width:88px;height:23px;">
<p>
<strong>P</strong></p>
</td>
<td style="width:96px;height:23px;">
<p>
<strong>R1</strong></p>
</td>
<td style="width:96px;height:23px;">
<p>
<strong>R2</strong></p>
</td>
<td style="width:96px;height:23px;">
<p>
<strong>R3</strong></p>
</td>
</tr>
<tr>
<td style="width:94px;height:23px;">
<p>
1139.77</p>
</td>
<td style="width:94px;height:23px;">
<p>
1142.02</p>
</td>
<td style="width:94px;height:23px;">
<p>
1144.56</p>
</td>
<td style="width:88px;height:23px;">
<p>
<strong>1146.81</strong></p>
</td>
<td style="width:96px;height:23px;">
<p>
1149.35</p>
</td>
<td style="width:96px;height:23px;">
<p>
1151.60</p>
</td>
<td style="width:96px;height:23px;">
<p>
1154.14</p>
</td>
</tr>
</tbody>
</table>
<p>
</p>
<p>
</p>
<p>
</p>
<p>
</p>
<p>
<span style="font-size:14px;"><span style="font-family:arial,helvetica,sans-serif;">Today’s (22<sup>nd </sup>Magh) volume : Rs 23.100 crores</span></span></p>
<p>
<span style="font-size:14px;"><span style="font-family:arial,helvetica,sans-serif;">Yesterdays (21<sup>st</sup> Magh) volume : Rs 36.436 crores</span></span></p>
<p>
<span style="font-size:14px;"><span style="font-family:arial,helvetica,sans-serif;"><strong>The Trading volume:</strong></span></span></p>
<p>
<span style="font-size:14px;"><span style="font-family:arial,helvetica,sans-serif;">Today’s trading volume Rs 23.100 crores has been lower as compared to yesterday’s trading volume of Rs 36.436 Crores. The trading volume does not show a promising bullish outlook when market has closed green and above the daily pivot.</span></span></p>
<p>
<span style="font-size:14px;"><span style="font-family:arial,helvetica,sans-serif;"><strong>Commentary:</strong></span></span></p>
<ul>
<li>
<span style="font-size:14px;"><span style="font-family:arial,helvetica,sans-serif;">- Market seems finding support and has grown higher than yesterdays close.</span></span></li>
<li>
<span style="font-size:14px;"><span style="font-family:arial,helvetica,sans-serif;">- Current market price 1147.10 is higher than tomorrows pivot 1146.81; that indicates market with further growth.</span></span></li>
<li>
<span style="font-size:14px;"><span style="font-family:arial,helvetica,sans-serif;">- Today market traded in lower volume than the yesterdays.</span></span></li>
</ul>
<p>
<span style="font-size:14px;"><span style="font-family:arial,helvetica,sans-serif;"><strong>Recommendations: </strong></span></span></p>
<ul>
<li>
<span style="font-size:14px;"><span style="font-family:arial,helvetica,sans-serif;">- Market may move up if sustained over the pivot 1146.81 but the lower trading volume today keeps all the analysts and traders in the chaos.</span></span></li>
<li>
<span style="font-size:14px;"><span style="font-family:arial,helvetica,sans-serif;">- If trading volume increases with rise in Nepse value tomorrow, the market may target to the weekly pivot 1164.683 which seems virtual at this time.</span></span></li>
<li>
<span style="font-size:14px;"><span style="font-family:arial,helvetica,sans-serif;">- Still the aggressive traders may sell some of their portfolios if they get an exit point to find another support level as an entry point in near future.</span></span></li>
</ul>
<p>
<span style="font-size:14px;"><span style="font-family:arial,helvetica,sans-serif;"><strong>Fundamental Outlook:</strong></span></span></p>
<ul>
<li>
<span style="font-size:14px;"><span style="font-family:arial,helvetica,sans-serif;">- The liquidity crisis in Banks seems still persisting and this has been major factor to affect the stock market in negative prices.</span></span></li>
<li>
<span style="font-size:14px;"><span style="font-family:arial,helvetica,sans-serif;">- Government is in verge to review the half annually performances of the current fiscal year. If government shows a probability to spend on the expenditures, the liquidity problem for the short period would be eased to relax the stock market for a price growth.</span></span></li>
<li>
<span style="font-size:14px;"><span style="font-family:arial,helvetica,sans-serif;">- The brokers’ branches out of Kathmandu may not only add the number of traders but may add the value too as a positive effect on market for the price elevation.</span></span></li>
</ul>
<p>
<span style="font-family:arial,helvetica,sans-serif;">Happy Trading……..!!!!!</span></p>
<p>
<img alt="" src="/app/webroot/userfiles/images/nepse.jpg" style="width: 500px; height: 395px;" /></p>
<p>
<strong><span style="font-size:14px;"><span style="font-family:arial,helvetica,sans-serif;">Nepse Daily Candle Chart Illustrates:</span></span></strong></p>
<ol>
<li>
<span style="font-size:14px;"><span style="font-family:arial,helvetica,sans-serif;">- A small green after two consecutive red. Is it harami candle stick pattern?</span></span></li>
<li>
<span style="font-size:14px;"><span style="font-family:arial,helvetica,sans-serif;">- Market inside a triangle where support lies at 1143.9 and resistant at level 1163.02</span></span></li>
<li>
<span style="font-size:14px;"><span style="font-family:arial,helvetica,sans-serif;">- If the trading volume rises with bullish mindset of investors market may target the weekly pivot value 1162 level.</span></span></li>
<li>
<span style="font-size:14px;"><span style="font-family:arial,helvetica,sans-serif;">- If market does not show a sign of recovery then market shall break the current support level to find a new low.</span></span></li>
</ol>
<p>
<img alt="" src="/app/webroot/userfiles/images/sens.jpg" style="width: 500px; height: 419px;" /></p>
<p>
<strong><span style="font-size:14px;"><span style="font-family:arial,helvetica,sans-serif;">Sensitive index daily candle chart illustrates:</span></span></strong></p>
<ol>
<li>
<span style="font-size:14px;"><span style="font-family:arial,helvetica,sans-serif;">- Tomorrows supports are 243.01 and 241.24</span></span></li>
<li>
<span style="font-size:14px;"><span style="font-family:arial,helvetica,sans-serif;">- The resistant value exists at 245.14</span></span></li>
</ol>
<p>
<img alt="" src="/app/webroot/userfiles/images/mindsnepal%281%29.jpg" style="width: 300px; height: 133px;" /></p>
<p>
<strong><em>Disclaimer:</em></strong></p>
<p>
<em>The information contained herein does not purport to be comprehensive and is strictly for information purposes only. It should not be regarded as investment/trading/financial advice. All the information is believed to come from reliable sources.</em></p>
<p>
</p>
<p>
</p>
',
'published' => true,
'created' => '2019-02-05',
'modified' => '2019-02-05',
'keywords' => '',
'description' => '',
'sortorder' => '9741',
'image' => '20190205051944_nepse 21magh.jpg',
'article_date' => '2019-02-05 00:00:00',
'homepage' => true,
'breaking_news' => false,
'main_news' => false,
'in_scroller' => false,
'user_id' => '22'
),
'ArticleCategory' => array(
'id' => '1',
'name' => 'NEWS',
'parentOf' => '0',
'published' => true,
'registered' => '2015-07-20 00:00:00',
'sortorder' => '158',
'del_flag' => '0',
'homepage' => true,
'display_in_menu' => true,
'user_id' => '1',
'created' => '0000-00-00 00:00:00',
'modified' => '2018-11-22 11:58:49'
),
'User' => array(
'password' => '*****',
'id' => '22',
'user_detail_id' => '1',
'group_id' => '24',
'username' => 'kishor.bam@newbusinessage.com',
'name' => '',
'email' => 'kishor.bam@newbusinessage.com',
'address' => '',
'gender' => '',
'access' => '1',
'phone' => '',
'access_type' => '0',
'activated' => false,
'sortorder' => '0',
'published' => '0',
'created' => '2018-11-30 10:47:22',
'last_login' => '2019-06-09 10:32:40',
'ip' => '202.63.242.112'
),
'ArticleComment' => array(),
'ArticleFeature' => array(),
'ArticleHasAuthor' => array(),
'ArticleHasTag' => array(),
'ArticleView' => array(
(int) 0 => array(
'article_id' => '9971',
'hit' => '1048'
)
),
'Slider' => array()
)
$current_user = null
$logged_in = false
$image = 'https://www.old.newbusinessage.com/app/webroot/img/news/20190205051944_nepse 21magh.jpg'
$user = null
$groupId = null
$user_id = null
$date = '2019-02-05 00:00:00'
$dateFromDatabase = (int) 1549304100
$newDate = 'Feb 05, 2019'
$articleView = array(
'article_id' => '9971',
'hit' => '1048'
)
$word_count = (int) 1053
$time_to_read = (float) 5.27
$time_to_read_min = (float) 5
$time_to_read_second = (float) 16
include - APP/View/Articles/view.ctp, line 241
View::_evaluate() - CORE/Cake/View/View.php, line 971
View::_render() - CORE/Cake/View/View.php, line 933
View::render() - CORE/Cake/View/View.php, line 473
Controller::render() - CORE/Cake/Controller/Controller.php, line 968
Dispatcher::_invoke() - CORE/Cake/Routing/Dispatcher.php, line 200
Dispatcher::dispatch() - CORE/Cake/Routing/Dispatcher.php, line 167
[main] - APP/webroot/index.php, line 117
CMP: 1147.10 NEPSE
The pivot table for tomorrow (23rd Magh)
S3
S2
S1
P
R1
R2
R3
1139.77
1142.02
1144.56
1146.81
1149.35
1151.60
1154.14
Today’s (22nd Magh) volume : Rs 23.100 crores
Yesterdays (21st Magh) volume : Rs 36.436 crores
The Trading volume:
Today’s trading volume Rs 23.100 crores has been lower as compared to yesterday’s trading volume of Rs 36.436 Crores. The trading volume does not show a promising bullish outlook when market has closed green and above the daily pivot.
Commentary:
- Market seems finding support and has grown higher than yesterdays close.
- Current market price 1147.10 is higher than tomorrows pivot 1146.81; that indicates market with further growth.
- Today market traded in lower volume than the yesterdays.
Recommendations:
- Market may move up if sustained over the pivot 1146.81 but the lower trading volume today keeps all the analysts and traders in the chaos.
- If trading volume increases with rise in Nepse value tomorrow, the market may target to the weekly pivot 1164.683 which seems virtual at this time.
- Still the aggressive traders may sell some of their portfolios if they get an exit point to find another support level as an entry point in near future.
Fundamental Outlook:
- The liquidity crisis in Banks seems still persisting and this has been major factor to affect the stock market in negative prices.
- Government is in verge to review the half annually performances of the current fiscal year. If government shows a probability to spend on the expenditures, the liquidity problem for the short period would be eased to relax the stock market for a price growth.
- The brokers’ branches out of Kathmandu may not only add the number of traders but may add the value too as a positive effect on market for the price elevation.
Happy Trading……..!!!!!
Nepse Daily Candle Chart Illustrates:
- A small green after two consecutive red. Is it harami candle stick pattern?
- Market inside a triangle where support lies at 1143.9 and resistant at level 1163.02
- If the trading volume rises with bullish mindset of investors market may target the weekly pivot value 1162 level.
- If market does not show a sign of recovery then market shall break the current support level to find a new low.
Sensitive index daily candle chart illustrates:
- Tomorrows supports are 243.01 and 241.24
- The resistant value exists at 245.14
Disclaimer:
The information contained herein does not purport to be comprehensive and is strictly for information purposes only. It should not be regarded as investment/trading/financial advice. All the information is believed to come from reliable sources.
FormHelper::create() - CORE/Cake/View/Helper/FormHelper.php, line 383
include - APP/View/Articles/view.ctp, line 273
View::_evaluate() - CORE/Cake/View/View.php, line 971
View::_render() - CORE/Cake/View/View.php, line 933
View::render() - CORE/Cake/View/View.php, line 473
Controller::render() - CORE/Cake/Controller/Controller.php, line 968
Dispatcher::_invoke() - CORE/Cake/Routing/Dispatcher.php, line 200
Dispatcher::dispatch() - CORE/Cake/Routing/Dispatcher.php, line 167
[main] - APP/webroot/index.php, line 117
$viewFile = '/var/www/html/newbusinessage.com/app/View/Elements/side_bar.ctp'
$dataForView = array(
'article' => array(
'Article' => array(
'id' => '9971',
'article_category_id' => '1',
'title' => 'Nepse Analysis for 6 Feb.',
'sub_title' => '',
'summary' => 'Today’s trading volume Rs 23.100 crores has been lower as compared to yesterday’s trading volume of Rs 36.436 Crores. ',
'content' => '<p>
<strong>CMP: 1147.10 NEPSE</strong></p>
<p>
<strong>The pivot table for tomorrow (23<sup>rd</sup> Magh)</strong></p>
<table align="left" border="1" cellpadding="0" cellspacing="0" style="width:658px;" width="658">
<tbody>
<tr>
<td style="width:94px;height:23px;">
<p>
<strong>S3</strong></p>
</td>
<td style="width:94px;height:23px;">
<p>
<strong>S2</strong></p>
</td>
<td style="width:94px;height:23px;">
<p>
<strong>S1</strong></p>
</td>
<td style="width:88px;height:23px;">
<p>
<strong>P</strong></p>
</td>
<td style="width:96px;height:23px;">
<p>
<strong>R1</strong></p>
</td>
<td style="width:96px;height:23px;">
<p>
<strong>R2</strong></p>
</td>
<td style="width:96px;height:23px;">
<p>
<strong>R3</strong></p>
</td>
</tr>
<tr>
<td style="width:94px;height:23px;">
<p>
1139.77</p>
</td>
<td style="width:94px;height:23px;">
<p>
1142.02</p>
</td>
<td style="width:94px;height:23px;">
<p>
1144.56</p>
</td>
<td style="width:88px;height:23px;">
<p>
<strong>1146.81</strong></p>
</td>
<td style="width:96px;height:23px;">
<p>
1149.35</p>
</td>
<td style="width:96px;height:23px;">
<p>
1151.60</p>
</td>
<td style="width:96px;height:23px;">
<p>
1154.14</p>
</td>
</tr>
</tbody>
</table>
<p>
</p>
<p>
</p>
<p>
</p>
<p>
</p>
<p>
<span style="font-size:14px;"><span style="font-family:arial,helvetica,sans-serif;">Today’s (22<sup>nd </sup>Magh) volume : Rs 23.100 crores</span></span></p>
<p>
<span style="font-size:14px;"><span style="font-family:arial,helvetica,sans-serif;">Yesterdays (21<sup>st</sup> Magh) volume : Rs 36.436 crores</span></span></p>
<p>
<span style="font-size:14px;"><span style="font-family:arial,helvetica,sans-serif;"><strong>The Trading volume:</strong></span></span></p>
<p>
<span style="font-size:14px;"><span style="font-family:arial,helvetica,sans-serif;">Today’s trading volume Rs 23.100 crores has been lower as compared to yesterday’s trading volume of Rs 36.436 Crores. The trading volume does not show a promising bullish outlook when market has closed green and above the daily pivot.</span></span></p>
<p>
<span style="font-size:14px;"><span style="font-family:arial,helvetica,sans-serif;"><strong>Commentary:</strong></span></span></p>
<ul>
<li>
<span style="font-size:14px;"><span style="font-family:arial,helvetica,sans-serif;">- Market seems finding support and has grown higher than yesterdays close.</span></span></li>
<li>
<span style="font-size:14px;"><span style="font-family:arial,helvetica,sans-serif;">- Current market price 1147.10 is higher than tomorrows pivot 1146.81; that indicates market with further growth.</span></span></li>
<li>
<span style="font-size:14px;"><span style="font-family:arial,helvetica,sans-serif;">- Today market traded in lower volume than the yesterdays.</span></span></li>
</ul>
<p>
<span style="font-size:14px;"><span style="font-family:arial,helvetica,sans-serif;"><strong>Recommendations: </strong></span></span></p>
<ul>
<li>
<span style="font-size:14px;"><span style="font-family:arial,helvetica,sans-serif;">- Market may move up if sustained over the pivot 1146.81 but the lower trading volume today keeps all the analysts and traders in the chaos.</span></span></li>
<li>
<span style="font-size:14px;"><span style="font-family:arial,helvetica,sans-serif;">- If trading volume increases with rise in Nepse value tomorrow, the market may target to the weekly pivot 1164.683 which seems virtual at this time.</span></span></li>
<li>
<span style="font-size:14px;"><span style="font-family:arial,helvetica,sans-serif;">- Still the aggressive traders may sell some of their portfolios if they get an exit point to find another support level as an entry point in near future.</span></span></li>
</ul>
<p>
<span style="font-size:14px;"><span style="font-family:arial,helvetica,sans-serif;"><strong>Fundamental Outlook:</strong></span></span></p>
<ul>
<li>
<span style="font-size:14px;"><span style="font-family:arial,helvetica,sans-serif;">- The liquidity crisis in Banks seems still persisting and this has been major factor to affect the stock market in negative prices.</span></span></li>
<li>
<span style="font-size:14px;"><span style="font-family:arial,helvetica,sans-serif;">- Government is in verge to review the half annually performances of the current fiscal year. If government shows a probability to spend on the expenditures, the liquidity problem for the short period would be eased to relax the stock market for a price growth.</span></span></li>
<li>
<span style="font-size:14px;"><span style="font-family:arial,helvetica,sans-serif;">- The brokers’ branches out of Kathmandu may not only add the number of traders but may add the value too as a positive effect on market for the price elevation.</span></span></li>
</ul>
<p>
<span style="font-family:arial,helvetica,sans-serif;">Happy Trading……..!!!!!</span></p>
<p>
<img alt="" src="/app/webroot/userfiles/images/nepse.jpg" style="width: 500px; height: 395px;" /></p>
<p>
<strong><span style="font-size:14px;"><span style="font-family:arial,helvetica,sans-serif;">Nepse Daily Candle Chart Illustrates:</span></span></strong></p>
<ol>
<li>
<span style="font-size:14px;"><span style="font-family:arial,helvetica,sans-serif;">- A small green after two consecutive red. Is it harami candle stick pattern?</span></span></li>
<li>
<span style="font-size:14px;"><span style="font-family:arial,helvetica,sans-serif;">- Market inside a triangle where support lies at 1143.9 and resistant at level 1163.02</span></span></li>
<li>
<span style="font-size:14px;"><span style="font-family:arial,helvetica,sans-serif;">- If the trading volume rises with bullish mindset of investors market may target the weekly pivot value 1162 level.</span></span></li>
<li>
<span style="font-size:14px;"><span style="font-family:arial,helvetica,sans-serif;">- If market does not show a sign of recovery then market shall break the current support level to find a new low.</span></span></li>
</ol>
<p>
<img alt="" src="/app/webroot/userfiles/images/sens.jpg" style="width: 500px; height: 419px;" /></p>
<p>
<strong><span style="font-size:14px;"><span style="font-family:arial,helvetica,sans-serif;">Sensitive index daily candle chart illustrates:</span></span></strong></p>
<ol>
<li>
<span style="font-size:14px;"><span style="font-family:arial,helvetica,sans-serif;">- Tomorrows supports are 243.01 and 241.24</span></span></li>
<li>
<span style="font-size:14px;"><span style="font-family:arial,helvetica,sans-serif;">- The resistant value exists at 245.14</span></span></li>
</ol>
<p>
<img alt="" src="/app/webroot/userfiles/images/mindsnepal%281%29.jpg" style="width: 300px; height: 133px;" /></p>
<p>
<strong><em>Disclaimer:</em></strong></p>
<p>
<em>The information contained herein does not purport to be comprehensive and is strictly for information purposes only. It should not be regarded as investment/trading/financial advice. All the information is believed to come from reliable sources.</em></p>
<p>
</p>
<p>
</p>
',
'published' => true,
'created' => '2019-02-05',
'modified' => '2019-02-05',
'keywords' => '',
'description' => '',
'sortorder' => '9741',
'image' => '20190205051944_nepse 21magh.jpg',
'article_date' => '2019-02-05 00:00:00',
'homepage' => true,
'breaking_news' => false,
'main_news' => false,
'in_scroller' => false,
'user_id' => '22'
),
'ArticleCategory' => array(
'id' => '1',
'name' => 'NEWS',
'parentOf' => '0',
'published' => true,
'registered' => '2015-07-20 00:00:00',
'sortorder' => '158',
'del_flag' => '0',
'homepage' => true,
'display_in_menu' => true,
'user_id' => '1',
'created' => '0000-00-00 00:00:00',
'modified' => '2018-11-22 11:58:49'
),
'User' => array(
'password' => '*****',
'id' => '22',
'user_detail_id' => '1',
'group_id' => '24',
'username' => 'kishor.bam@newbusinessage.com',
'name' => '',
'email' => 'kishor.bam@newbusinessage.com',
'address' => '',
'gender' => '',
'access' => '1',
'phone' => '',
'access_type' => '0',
'activated' => false,
'sortorder' => '0',
'published' => '0',
'created' => '2018-11-30 10:47:22',
'last_login' => '2019-06-09 10:32:40',
'ip' => '202.63.242.112'
),
'ArticleComment' => array(),
'ArticleFeature' => array(),
'ArticleHasAuthor' => array(),
'ArticleHasTag' => array(),
'ArticleView' => array(
(int) 0 => array(
[maximum depth reached]
)
),
'Slider' => array()
),
'current_user' => null,
'logged_in' => false
)
$article = array(
'Article' => array(
'id' => '9971',
'article_category_id' => '1',
'title' => 'Nepse Analysis for 6 Feb.',
'sub_title' => '',
'summary' => 'Today’s trading volume Rs 23.100 crores has been lower as compared to yesterday’s trading volume of Rs 36.436 Crores. ',
'content' => '<p>
<strong>CMP: 1147.10 NEPSE</strong></p>
<p>
<strong>The pivot table for tomorrow (23<sup>rd</sup> Magh)</strong></p>
<table align="left" border="1" cellpadding="0" cellspacing="0" style="width:658px;" width="658">
<tbody>
<tr>
<td style="width:94px;height:23px;">
<p>
<strong>S3</strong></p>
</td>
<td style="width:94px;height:23px;">
<p>
<strong>S2</strong></p>
</td>
<td style="width:94px;height:23px;">
<p>
<strong>S1</strong></p>
</td>
<td style="width:88px;height:23px;">
<p>
<strong>P</strong></p>
</td>
<td style="width:96px;height:23px;">
<p>
<strong>R1</strong></p>
</td>
<td style="width:96px;height:23px;">
<p>
<strong>R2</strong></p>
</td>
<td style="width:96px;height:23px;">
<p>
<strong>R3</strong></p>
</td>
</tr>
<tr>
<td style="width:94px;height:23px;">
<p>
1139.77</p>
</td>
<td style="width:94px;height:23px;">
<p>
1142.02</p>
</td>
<td style="width:94px;height:23px;">
<p>
1144.56</p>
</td>
<td style="width:88px;height:23px;">
<p>
<strong>1146.81</strong></p>
</td>
<td style="width:96px;height:23px;">
<p>
1149.35</p>
</td>
<td style="width:96px;height:23px;">
<p>
1151.60</p>
</td>
<td style="width:96px;height:23px;">
<p>
1154.14</p>
</td>
</tr>
</tbody>
</table>
<p>
</p>
<p>
</p>
<p>
</p>
<p>
</p>
<p>
<span style="font-size:14px;"><span style="font-family:arial,helvetica,sans-serif;">Today’s (22<sup>nd </sup>Magh) volume : Rs 23.100 crores</span></span></p>
<p>
<span style="font-size:14px;"><span style="font-family:arial,helvetica,sans-serif;">Yesterdays (21<sup>st</sup> Magh) volume : Rs 36.436 crores</span></span></p>
<p>
<span style="font-size:14px;"><span style="font-family:arial,helvetica,sans-serif;"><strong>The Trading volume:</strong></span></span></p>
<p>
<span style="font-size:14px;"><span style="font-family:arial,helvetica,sans-serif;">Today’s trading volume Rs 23.100 crores has been lower as compared to yesterday’s trading volume of Rs 36.436 Crores. The trading volume does not show a promising bullish outlook when market has closed green and above the daily pivot.</span></span></p>
<p>
<span style="font-size:14px;"><span style="font-family:arial,helvetica,sans-serif;"><strong>Commentary:</strong></span></span></p>
<ul>
<li>
<span style="font-size:14px;"><span style="font-family:arial,helvetica,sans-serif;">- Market seems finding support and has grown higher than yesterdays close.</span></span></li>
<li>
<span style="font-size:14px;"><span style="font-family:arial,helvetica,sans-serif;">- Current market price 1147.10 is higher than tomorrows pivot 1146.81; that indicates market with further growth.</span></span></li>
<li>
<span style="font-size:14px;"><span style="font-family:arial,helvetica,sans-serif;">- Today market traded in lower volume than the yesterdays.</span></span></li>
</ul>
<p>
<span style="font-size:14px;"><span style="font-family:arial,helvetica,sans-serif;"><strong>Recommendations: </strong></span></span></p>
<ul>
<li>
<span style="font-size:14px;"><span style="font-family:arial,helvetica,sans-serif;">- Market may move up if sustained over the pivot 1146.81 but the lower trading volume today keeps all the analysts and traders in the chaos.</span></span></li>
<li>
<span style="font-size:14px;"><span style="font-family:arial,helvetica,sans-serif;">- If trading volume increases with rise in Nepse value tomorrow, the market may target to the weekly pivot 1164.683 which seems virtual at this time.</span></span></li>
<li>
<span style="font-size:14px;"><span style="font-family:arial,helvetica,sans-serif;">- Still the aggressive traders may sell some of their portfolios if they get an exit point to find another support level as an entry point in near future.</span></span></li>
</ul>
<p>
<span style="font-size:14px;"><span style="font-family:arial,helvetica,sans-serif;"><strong>Fundamental Outlook:</strong></span></span></p>
<ul>
<li>
<span style="font-size:14px;"><span style="font-family:arial,helvetica,sans-serif;">- The liquidity crisis in Banks seems still persisting and this has been major factor to affect the stock market in negative prices.</span></span></li>
<li>
<span style="font-size:14px;"><span style="font-family:arial,helvetica,sans-serif;">- Government is in verge to review the half annually performances of the current fiscal year. If government shows a probability to spend on the expenditures, the liquidity problem for the short period would be eased to relax the stock market for a price growth.</span></span></li>
<li>
<span style="font-size:14px;"><span style="font-family:arial,helvetica,sans-serif;">- The brokers’ branches out of Kathmandu may not only add the number of traders but may add the value too as a positive effect on market for the price elevation.</span></span></li>
</ul>
<p>
<span style="font-family:arial,helvetica,sans-serif;">Happy Trading……..!!!!!</span></p>
<p>
<img alt="" src="/app/webroot/userfiles/images/nepse.jpg" style="width: 500px; height: 395px;" /></p>
<p>
<strong><span style="font-size:14px;"><span style="font-family:arial,helvetica,sans-serif;">Nepse Daily Candle Chart Illustrates:</span></span></strong></p>
<ol>
<li>
<span style="font-size:14px;"><span style="font-family:arial,helvetica,sans-serif;">- A small green after two consecutive red. Is it harami candle stick pattern?</span></span></li>
<li>
<span style="font-size:14px;"><span style="font-family:arial,helvetica,sans-serif;">- Market inside a triangle where support lies at 1143.9 and resistant at level 1163.02</span></span></li>
<li>
<span style="font-size:14px;"><span style="font-family:arial,helvetica,sans-serif;">- If the trading volume rises with bullish mindset of investors market may target the weekly pivot value 1162 level.</span></span></li>
<li>
<span style="font-size:14px;"><span style="font-family:arial,helvetica,sans-serif;">- If market does not show a sign of recovery then market shall break the current support level to find a new low.</span></span></li>
</ol>
<p>
<img alt="" src="/app/webroot/userfiles/images/sens.jpg" style="width: 500px; height: 419px;" /></p>
<p>
<strong><span style="font-size:14px;"><span style="font-family:arial,helvetica,sans-serif;">Sensitive index daily candle chart illustrates:</span></span></strong></p>
<ol>
<li>
<span style="font-size:14px;"><span style="font-family:arial,helvetica,sans-serif;">- Tomorrows supports are 243.01 and 241.24</span></span></li>
<li>
<span style="font-size:14px;"><span style="font-family:arial,helvetica,sans-serif;">- The resistant value exists at 245.14</span></span></li>
</ol>
<p>
<img alt="" src="/app/webroot/userfiles/images/mindsnepal%281%29.jpg" style="width: 300px; height: 133px;" /></p>
<p>
<strong><em>Disclaimer:</em></strong></p>
<p>
<em>The information contained herein does not purport to be comprehensive and is strictly for information purposes only. It should not be regarded as investment/trading/financial advice. All the information is believed to come from reliable sources.</em></p>
<p>
</p>
<p>
</p>
',
'published' => true,
'created' => '2019-02-05',
'modified' => '2019-02-05',
'keywords' => '',
'description' => '',
'sortorder' => '9741',
'image' => '20190205051944_nepse 21magh.jpg',
'article_date' => '2019-02-05 00:00:00',
'homepage' => true,
'breaking_news' => false,
'main_news' => false,
'in_scroller' => false,
'user_id' => '22'
),
'ArticleCategory' => array(
'id' => '1',
'name' => 'NEWS',
'parentOf' => '0',
'published' => true,
'registered' => '2015-07-20 00:00:00',
'sortorder' => '158',
'del_flag' => '0',
'homepage' => true,
'display_in_menu' => true,
'user_id' => '1',
'created' => '0000-00-00 00:00:00',
'modified' => '2018-11-22 11:58:49'
),
'User' => array(
'password' => '*****',
'id' => '22',
'user_detail_id' => '1',
'group_id' => '24',
'username' => 'kishor.bam@newbusinessage.com',
'name' => '',
'email' => 'kishor.bam@newbusinessage.com',
'address' => '',
'gender' => '',
'access' => '1',
'phone' => '',
'access_type' => '0',
'activated' => false,
'sortorder' => '0',
'published' => '0',
'created' => '2018-11-30 10:47:22',
'last_login' => '2019-06-09 10:32:40',
'ip' => '202.63.242.112'
),
'ArticleComment' => array(),
'ArticleFeature' => array(),
'ArticleHasAuthor' => array(),
'ArticleHasTag' => array(),
'ArticleView' => array(
(int) 0 => array(
'article_id' => '9971',
'hit' => '1048'
)
),
'Slider' => array()
)
$current_user = null
$logged_in = false
include - APP/View/Elements/side_bar.ctp, line 60
View::_evaluate() - CORE/Cake/View/View.php, line 971
View::_render() - CORE/Cake/View/View.php, line 933
View::_renderElement() - CORE/Cake/View/View.php, line 1224
View::element() - CORE/Cake/View/View.php, line 418
include - APP/View/Articles/view.ctp, line 391
View::_evaluate() - CORE/Cake/View/View.php, line 971
View::_render() - CORE/Cake/View/View.php, line 933
View::render() - CORE/Cake/View/View.php, line 473
Controller::render() - CORE/Cake/Controller/Controller.php, line 968
Dispatcher::_invoke() - CORE/Cake/Routing/Dispatcher.php, line 200
Dispatcher::dispatch() - CORE/Cake/Routing/Dispatcher.php, line 167
[main] - APP/webroot/index.php, line 117
Warning (2): simplexml_load_file() [<a href='http://php.net/function.simplexml-load-file'>function.simplexml-load-file</a>]: I/O warning : failed to load external entity "" [APP/View/Elements/side_bar.ctp, line 60]
$viewFile = '/var/www/html/newbusinessage.com/app/View/Elements/side_bar.ctp'
$dataForView = array(
'article' => array(
'Article' => array(
'id' => '9971',
'article_category_id' => '1',
'title' => 'Nepse Analysis for 6 Feb.',
'sub_title' => '',
'summary' => 'Today’s trading volume Rs 23.100 crores has been lower as compared to yesterday’s trading volume of Rs 36.436 Crores. ',
'content' => '<p>
<strong>CMP: 1147.10 NEPSE</strong></p>
<p>
<strong>The pivot table for tomorrow (23<sup>rd</sup> Magh)</strong></p>
<table align="left" border="1" cellpadding="0" cellspacing="0" style="width:658px;" width="658">
<tbody>
<tr>
<td style="width:94px;height:23px;">
<p>
<strong>S3</strong></p>
</td>
<td style="width:94px;height:23px;">
<p>
<strong>S2</strong></p>
</td>
<td style="width:94px;height:23px;">
<p>
<strong>S1</strong></p>
</td>
<td style="width:88px;height:23px;">
<p>
<strong>P</strong></p>
</td>
<td style="width:96px;height:23px;">
<p>
<strong>R1</strong></p>
</td>
<td style="width:96px;height:23px;">
<p>
<strong>R2</strong></p>
</td>
<td style="width:96px;height:23px;">
<p>
<strong>R3</strong></p>
</td>
</tr>
<tr>
<td style="width:94px;height:23px;">
<p>
1139.77</p>
</td>
<td style="width:94px;height:23px;">
<p>
1142.02</p>
</td>
<td style="width:94px;height:23px;">
<p>
1144.56</p>
</td>
<td style="width:88px;height:23px;">
<p>
<strong>1146.81</strong></p>
</td>
<td style="width:96px;height:23px;">
<p>
1149.35</p>
</td>
<td style="width:96px;height:23px;">
<p>
1151.60</p>
</td>
<td style="width:96px;height:23px;">
<p>
1154.14</p>
</td>
</tr>
</tbody>
</table>
<p>
</p>
<p>
</p>
<p>
</p>
<p>
</p>
<p>
<span style="font-size:14px;"><span style="font-family:arial,helvetica,sans-serif;">Today’s (22<sup>nd </sup>Magh) volume : Rs 23.100 crores</span></span></p>
<p>
<span style="font-size:14px;"><span style="font-family:arial,helvetica,sans-serif;">Yesterdays (21<sup>st</sup> Magh) volume : Rs 36.436 crores</span></span></p>
<p>
<span style="font-size:14px;"><span style="font-family:arial,helvetica,sans-serif;"><strong>The Trading volume:</strong></span></span></p>
<p>
<span style="font-size:14px;"><span style="font-family:arial,helvetica,sans-serif;">Today’s trading volume Rs 23.100 crores has been lower as compared to yesterday’s trading volume of Rs 36.436 Crores. The trading volume does not show a promising bullish outlook when market has closed green and above the daily pivot.</span></span></p>
<p>
<span style="font-size:14px;"><span style="font-family:arial,helvetica,sans-serif;"><strong>Commentary:</strong></span></span></p>
<ul>
<li>
<span style="font-size:14px;"><span style="font-family:arial,helvetica,sans-serif;">- Market seems finding support and has grown higher than yesterdays close.</span></span></li>
<li>
<span style="font-size:14px;"><span style="font-family:arial,helvetica,sans-serif;">- Current market price 1147.10 is higher than tomorrows pivot 1146.81; that indicates market with further growth.</span></span></li>
<li>
<span style="font-size:14px;"><span style="font-family:arial,helvetica,sans-serif;">- Today market traded in lower volume than the yesterdays.</span></span></li>
</ul>
<p>
<span style="font-size:14px;"><span style="font-family:arial,helvetica,sans-serif;"><strong>Recommendations: </strong></span></span></p>
<ul>
<li>
<span style="font-size:14px;"><span style="font-family:arial,helvetica,sans-serif;">- Market may move up if sustained over the pivot 1146.81 but the lower trading volume today keeps all the analysts and traders in the chaos.</span></span></li>
<li>
<span style="font-size:14px;"><span style="font-family:arial,helvetica,sans-serif;">- If trading volume increases with rise in Nepse value tomorrow, the market may target to the weekly pivot 1164.683 which seems virtual at this time.</span></span></li>
<li>
<span style="font-size:14px;"><span style="font-family:arial,helvetica,sans-serif;">- Still the aggressive traders may sell some of their portfolios if they get an exit point to find another support level as an entry point in near future.</span></span></li>
</ul>
<p>
<span style="font-size:14px;"><span style="font-family:arial,helvetica,sans-serif;"><strong>Fundamental Outlook:</strong></span></span></p>
<ul>
<li>
<span style="font-size:14px;"><span style="font-family:arial,helvetica,sans-serif;">- The liquidity crisis in Banks seems still persisting and this has been major factor to affect the stock market in negative prices.</span></span></li>
<li>
<span style="font-size:14px;"><span style="font-family:arial,helvetica,sans-serif;">- Government is in verge to review the half annually performances of the current fiscal year. If government shows a probability to spend on the expenditures, the liquidity problem for the short period would be eased to relax the stock market for a price growth.</span></span></li>
<li>
<span style="font-size:14px;"><span style="font-family:arial,helvetica,sans-serif;">- The brokers’ branches out of Kathmandu may not only add the number of traders but may add the value too as a positive effect on market for the price elevation.</span></span></li>
</ul>
<p>
<span style="font-family:arial,helvetica,sans-serif;">Happy Trading……..!!!!!</span></p>
<p>
<img alt="" src="/app/webroot/userfiles/images/nepse.jpg" style="width: 500px; height: 395px;" /></p>
<p>
<strong><span style="font-size:14px;"><span style="font-family:arial,helvetica,sans-serif;">Nepse Daily Candle Chart Illustrates:</span></span></strong></p>
<ol>
<li>
<span style="font-size:14px;"><span style="font-family:arial,helvetica,sans-serif;">- A small green after two consecutive red. Is it harami candle stick pattern?</span></span></li>
<li>
<span style="font-size:14px;"><span style="font-family:arial,helvetica,sans-serif;">- Market inside a triangle where support lies at 1143.9 and resistant at level 1163.02</span></span></li>
<li>
<span style="font-size:14px;"><span style="font-family:arial,helvetica,sans-serif;">- If the trading volume rises with bullish mindset of investors market may target the weekly pivot value 1162 level.</span></span></li>
<li>
<span style="font-size:14px;"><span style="font-family:arial,helvetica,sans-serif;">- If market does not show a sign of recovery then market shall break the current support level to find a new low.</span></span></li>
</ol>
<p>
<img alt="" src="/app/webroot/userfiles/images/sens.jpg" style="width: 500px; height: 419px;" /></p>
<p>
<strong><span style="font-size:14px;"><span style="font-family:arial,helvetica,sans-serif;">Sensitive index daily candle chart illustrates:</span></span></strong></p>
<ol>
<li>
<span style="font-size:14px;"><span style="font-family:arial,helvetica,sans-serif;">- Tomorrows supports are 243.01 and 241.24</span></span></li>
<li>
<span style="font-size:14px;"><span style="font-family:arial,helvetica,sans-serif;">- The resistant value exists at 245.14</span></span></li>
</ol>
<p>
<img alt="" src="/app/webroot/userfiles/images/mindsnepal%281%29.jpg" style="width: 300px; height: 133px;" /></p>
<p>
<strong><em>Disclaimer:</em></strong></p>
<p>
<em>The information contained herein does not purport to be comprehensive and is strictly for information purposes only. It should not be regarded as investment/trading/financial advice. All the information is believed to come from reliable sources.</em></p>
<p>
</p>
<p>
</p>
',
'published' => true,
'created' => '2019-02-05',
'modified' => '2019-02-05',
'keywords' => '',
'description' => '',
'sortorder' => '9741',
'image' => '20190205051944_nepse 21magh.jpg',
'article_date' => '2019-02-05 00:00:00',
'homepage' => true,
'breaking_news' => false,
'main_news' => false,
'in_scroller' => false,
'user_id' => '22'
),
'ArticleCategory' => array(
'id' => '1',
'name' => 'NEWS',
'parentOf' => '0',
'published' => true,
'registered' => '2015-07-20 00:00:00',
'sortorder' => '158',
'del_flag' => '0',
'homepage' => true,
'display_in_menu' => true,
'user_id' => '1',
'created' => '0000-00-00 00:00:00',
'modified' => '2018-11-22 11:58:49'
),
'User' => array(
'password' => '*****',
'id' => '22',
'user_detail_id' => '1',
'group_id' => '24',
'username' => 'kishor.bam@newbusinessage.com',
'name' => '',
'email' => 'kishor.bam@newbusinessage.com',
'address' => '',
'gender' => '',
'access' => '1',
'phone' => '',
'access_type' => '0',
'activated' => false,
'sortorder' => '0',
'published' => '0',
'created' => '2018-11-30 10:47:22',
'last_login' => '2019-06-09 10:32:40',
'ip' => '202.63.242.112'
),
'ArticleComment' => array(),
'ArticleFeature' => array(),
'ArticleHasAuthor' => array(),
'ArticleHasTag' => array(),
'ArticleView' => array(
(int) 0 => array(
[maximum depth reached]
)
),
'Slider' => array()
),
'current_user' => null,
'logged_in' => false
)
$article = array(
'Article' => array(
'id' => '9971',
'article_category_id' => '1',
'title' => 'Nepse Analysis for 6 Feb.',
'sub_title' => '',
'summary' => 'Today’s trading volume Rs 23.100 crores has been lower as compared to yesterday’s trading volume of Rs 36.436 Crores. ',
'content' => '<p>
<strong>CMP: 1147.10 NEPSE</strong></p>
<p>
<strong>The pivot table for tomorrow (23<sup>rd</sup> Magh)</strong></p>
<table align="left" border="1" cellpadding="0" cellspacing="0" style="width:658px;" width="658">
<tbody>
<tr>
<td style="width:94px;height:23px;">
<p>
<strong>S3</strong></p>
</td>
<td style="width:94px;height:23px;">
<p>
<strong>S2</strong></p>
</td>
<td style="width:94px;height:23px;">
<p>
<strong>S1</strong></p>
</td>
<td style="width:88px;height:23px;">
<p>
<strong>P</strong></p>
</td>
<td style="width:96px;height:23px;">
<p>
<strong>R1</strong></p>
</td>
<td style="width:96px;height:23px;">
<p>
<strong>R2</strong></p>
</td>
<td style="width:96px;height:23px;">
<p>
<strong>R3</strong></p>
</td>
</tr>
<tr>
<td style="width:94px;height:23px;">
<p>
1139.77</p>
</td>
<td style="width:94px;height:23px;">
<p>
1142.02</p>
</td>
<td style="width:94px;height:23px;">
<p>
1144.56</p>
</td>
<td style="width:88px;height:23px;">
<p>
<strong>1146.81</strong></p>
</td>
<td style="width:96px;height:23px;">
<p>
1149.35</p>
</td>
<td style="width:96px;height:23px;">
<p>
1151.60</p>
</td>
<td style="width:96px;height:23px;">
<p>
1154.14</p>
</td>
</tr>
</tbody>
</table>
<p>
</p>
<p>
</p>
<p>
</p>
<p>
</p>
<p>
<span style="font-size:14px;"><span style="font-family:arial,helvetica,sans-serif;">Today’s (22<sup>nd </sup>Magh) volume : Rs 23.100 crores</span></span></p>
<p>
<span style="font-size:14px;"><span style="font-family:arial,helvetica,sans-serif;">Yesterdays (21<sup>st</sup> Magh) volume : Rs 36.436 crores</span></span></p>
<p>
<span style="font-size:14px;"><span style="font-family:arial,helvetica,sans-serif;"><strong>The Trading volume:</strong></span></span></p>
<p>
<span style="font-size:14px;"><span style="font-family:arial,helvetica,sans-serif;">Today’s trading volume Rs 23.100 crores has been lower as compared to yesterday’s trading volume of Rs 36.436 Crores. The trading volume does not show a promising bullish outlook when market has closed green and above the daily pivot.</span></span></p>
<p>
<span style="font-size:14px;"><span style="font-family:arial,helvetica,sans-serif;"><strong>Commentary:</strong></span></span></p>
<ul>
<li>
<span style="font-size:14px;"><span style="font-family:arial,helvetica,sans-serif;">- Market seems finding support and has grown higher than yesterdays close.</span></span></li>
<li>
<span style="font-size:14px;"><span style="font-family:arial,helvetica,sans-serif;">- Current market price 1147.10 is higher than tomorrows pivot 1146.81; that indicates market with further growth.</span></span></li>
<li>
<span style="font-size:14px;"><span style="font-family:arial,helvetica,sans-serif;">- Today market traded in lower volume than the yesterdays.</span></span></li>
</ul>
<p>
<span style="font-size:14px;"><span style="font-family:arial,helvetica,sans-serif;"><strong>Recommendations: </strong></span></span></p>
<ul>
<li>
<span style="font-size:14px;"><span style="font-family:arial,helvetica,sans-serif;">- Market may move up if sustained over the pivot 1146.81 but the lower trading volume today keeps all the analysts and traders in the chaos.</span></span></li>
<li>
<span style="font-size:14px;"><span style="font-family:arial,helvetica,sans-serif;">- If trading volume increases with rise in Nepse value tomorrow, the market may target to the weekly pivot 1164.683 which seems virtual at this time.</span></span></li>
<li>
<span style="font-size:14px;"><span style="font-family:arial,helvetica,sans-serif;">- Still the aggressive traders may sell some of their portfolios if they get an exit point to find another support level as an entry point in near future.</span></span></li>
</ul>
<p>
<span style="font-size:14px;"><span style="font-family:arial,helvetica,sans-serif;"><strong>Fundamental Outlook:</strong></span></span></p>
<ul>
<li>
<span style="font-size:14px;"><span style="font-family:arial,helvetica,sans-serif;">- The liquidity crisis in Banks seems still persisting and this has been major factor to affect the stock market in negative prices.</span></span></li>
<li>
<span style="font-size:14px;"><span style="font-family:arial,helvetica,sans-serif;">- Government is in verge to review the half annually performances of the current fiscal year. If government shows a probability to spend on the expenditures, the liquidity problem for the short period would be eased to relax the stock market for a price growth.</span></span></li>
<li>
<span style="font-size:14px;"><span style="font-family:arial,helvetica,sans-serif;">- The brokers’ branches out of Kathmandu may not only add the number of traders but may add the value too as a positive effect on market for the price elevation.</span></span></li>
</ul>
<p>
<span style="font-family:arial,helvetica,sans-serif;">Happy Trading……..!!!!!</span></p>
<p>
<img alt="" src="/app/webroot/userfiles/images/nepse.jpg" style="width: 500px; height: 395px;" /></p>
<p>
<strong><span style="font-size:14px;"><span style="font-family:arial,helvetica,sans-serif;">Nepse Daily Candle Chart Illustrates:</span></span></strong></p>
<ol>
<li>
<span style="font-size:14px;"><span style="font-family:arial,helvetica,sans-serif;">- A small green after two consecutive red. Is it harami candle stick pattern?</span></span></li>
<li>
<span style="font-size:14px;"><span style="font-family:arial,helvetica,sans-serif;">- Market inside a triangle where support lies at 1143.9 and resistant at level 1163.02</span></span></li>
<li>
<span style="font-size:14px;"><span style="font-family:arial,helvetica,sans-serif;">- If the trading volume rises with bullish mindset of investors market may target the weekly pivot value 1162 level.</span></span></li>
<li>
<span style="font-size:14px;"><span style="font-family:arial,helvetica,sans-serif;">- If market does not show a sign of recovery then market shall break the current support level to find a new low.</span></span></li>
</ol>
<p>
<img alt="" src="/app/webroot/userfiles/images/sens.jpg" style="width: 500px; height: 419px;" /></p>
<p>
<strong><span style="font-size:14px;"><span style="font-family:arial,helvetica,sans-serif;">Sensitive index daily candle chart illustrates:</span></span></strong></p>
<ol>
<li>
<span style="font-size:14px;"><span style="font-family:arial,helvetica,sans-serif;">- Tomorrows supports are 243.01 and 241.24</span></span></li>
<li>
<span style="font-size:14px;"><span style="font-family:arial,helvetica,sans-serif;">- The resistant value exists at 245.14</span></span></li>
</ol>
<p>
<img alt="" src="/app/webroot/userfiles/images/mindsnepal%281%29.jpg" style="width: 300px; height: 133px;" /></p>
<p>
<strong><em>Disclaimer:</em></strong></p>
<p>
<em>The information contained herein does not purport to be comprehensive and is strictly for information purposes only. It should not be regarded as investment/trading/financial advice. All the information is believed to come from reliable sources.</em></p>
<p>
</p>
<p>
</p>
',
'published' => true,
'created' => '2019-02-05',
'modified' => '2019-02-05',
'keywords' => '',
'description' => '',
'sortorder' => '9741',
'image' => '20190205051944_nepse 21magh.jpg',
'article_date' => '2019-02-05 00:00:00',
'homepage' => true,
'breaking_news' => false,
'main_news' => false,
'in_scroller' => false,
'user_id' => '22'
),
'ArticleCategory' => array(
'id' => '1',
'name' => 'NEWS',
'parentOf' => '0',
'published' => true,
'registered' => '2015-07-20 00:00:00',
'sortorder' => '158',
'del_flag' => '0',
'homepage' => true,
'display_in_menu' => true,
'user_id' => '1',
'created' => '0000-00-00 00:00:00',
'modified' => '2018-11-22 11:58:49'
),
'User' => array(
'password' => '*****',
'id' => '22',
'user_detail_id' => '1',
'group_id' => '24',
'username' => 'kishor.bam@newbusinessage.com',
'name' => '',
'email' => 'kishor.bam@newbusinessage.com',
'address' => '',
'gender' => '',
'access' => '1',
'phone' => '',
'access_type' => '0',
'activated' => false,
'sortorder' => '0',
'published' => '0',
'created' => '2018-11-30 10:47:22',
'last_login' => '2019-06-09 10:32:40',
'ip' => '202.63.242.112'
),
'ArticleComment' => array(),
'ArticleFeature' => array(),
'ArticleHasAuthor' => array(),
'ArticleHasTag' => array(),
'ArticleView' => array(
(int) 0 => array(
'article_id' => '9971',
'hit' => '1048'
)
),
'Slider' => array()
)
$current_user = null
$logged_in = false
simplexml_load_file - [internal], line ??
include - APP/View/Elements/side_bar.ctp, line 60
View::_evaluate() - CORE/Cake/View/View.php, line 971
View::_render() - CORE/Cake/View/View.php, line 933
View::_renderElement() - CORE/Cake/View/View.php, line 1224
View::element() - CORE/Cake/View/View.php, line 418
include - APP/View/Articles/view.ctp, line 391
View::_evaluate() - CORE/Cake/View/View.php, line 971
View::_render() - CORE/Cake/View/View.php, line 933
View::render() - CORE/Cake/View/View.php, line 473
Controller::render() - CORE/Cake/Controller/Controller.php, line 968
Dispatcher::_invoke() - CORE/Cake/Routing/Dispatcher.php, line 200
Dispatcher::dispatch() - CORE/Cake/Routing/Dispatcher.php, line 167
[main] - APP/webroot/index.php, line 117
file not found!
Notice (8): Undefined variable: file [APP/View/Elements/side_bar.ctp, line 133]
$viewFile = '/var/www/html/newbusinessage.com/app/View/Elements/side_bar.ctp'
$dataForView = array(
'article' => array(
'Article' => array(
'id' => '9971',
'article_category_id' => '1',
'title' => 'Nepse Analysis for 6 Feb.',
'sub_title' => '',
'summary' => 'Today’s trading volume Rs 23.100 crores has been lower as compared to yesterday’s trading volume of Rs 36.436 Crores. ',
'content' => '<p>
<strong>CMP: 1147.10 NEPSE</strong></p>
<p>
<strong>The pivot table for tomorrow (23<sup>rd</sup> Magh)</strong></p>
<table align="left" border="1" cellpadding="0" cellspacing="0" style="width:658px;" width="658">
<tbody>
<tr>
<td style="width:94px;height:23px;">
<p>
<strong>S3</strong></p>
</td>
<td style="width:94px;height:23px;">
<p>
<strong>S2</strong></p>
</td>
<td style="width:94px;height:23px;">
<p>
<strong>S1</strong></p>
</td>
<td style="width:88px;height:23px;">
<p>
<strong>P</strong></p>
</td>
<td style="width:96px;height:23px;">
<p>
<strong>R1</strong></p>
</td>
<td style="width:96px;height:23px;">
<p>
<strong>R2</strong></p>
</td>
<td style="width:96px;height:23px;">
<p>
<strong>R3</strong></p>
</td>
</tr>
<tr>
<td style="width:94px;height:23px;">
<p>
1139.77</p>
</td>
<td style="width:94px;height:23px;">
<p>
1142.02</p>
</td>
<td style="width:94px;height:23px;">
<p>
1144.56</p>
</td>
<td style="width:88px;height:23px;">
<p>
<strong>1146.81</strong></p>
</td>
<td style="width:96px;height:23px;">
<p>
1149.35</p>
</td>
<td style="width:96px;height:23px;">
<p>
1151.60</p>
</td>
<td style="width:96px;height:23px;">
<p>
1154.14</p>
</td>
</tr>
</tbody>
</table>
<p>
</p>
<p>
</p>
<p>
</p>
<p>
</p>
<p>
<span style="font-size:14px;"><span style="font-family:arial,helvetica,sans-serif;">Today’s (22<sup>nd </sup>Magh) volume : Rs 23.100 crores</span></span></p>
<p>
<span style="font-size:14px;"><span style="font-family:arial,helvetica,sans-serif;">Yesterdays (21<sup>st</sup> Magh) volume : Rs 36.436 crores</span></span></p>
<p>
<span style="font-size:14px;"><span style="font-family:arial,helvetica,sans-serif;"><strong>The Trading volume:</strong></span></span></p>
<p>
<span style="font-size:14px;"><span style="font-family:arial,helvetica,sans-serif;">Today’s trading volume Rs 23.100 crores has been lower as compared to yesterday’s trading volume of Rs 36.436 Crores. The trading volume does not show a promising bullish outlook when market has closed green and above the daily pivot.</span></span></p>
<p>
<span style="font-size:14px;"><span style="font-family:arial,helvetica,sans-serif;"><strong>Commentary:</strong></span></span></p>
<ul>
<li>
<span style="font-size:14px;"><span style="font-family:arial,helvetica,sans-serif;">- Market seems finding support and has grown higher than yesterdays close.</span></span></li>
<li>
<span style="font-size:14px;"><span style="font-family:arial,helvetica,sans-serif;">- Current market price 1147.10 is higher than tomorrows pivot 1146.81; that indicates market with further growth.</span></span></li>
<li>
<span style="font-size:14px;"><span style="font-family:arial,helvetica,sans-serif;">- Today market traded in lower volume than the yesterdays.</span></span></li>
</ul>
<p>
<span style="font-size:14px;"><span style="font-family:arial,helvetica,sans-serif;"><strong>Recommendations: </strong></span></span></p>
<ul>
<li>
<span style="font-size:14px;"><span style="font-family:arial,helvetica,sans-serif;">- Market may move up if sustained over the pivot 1146.81 but the lower trading volume today keeps all the analysts and traders in the chaos.</span></span></li>
<li>
<span style="font-size:14px;"><span style="font-family:arial,helvetica,sans-serif;">- If trading volume increases with rise in Nepse value tomorrow, the market may target to the weekly pivot 1164.683 which seems virtual at this time.</span></span></li>
<li>
<span style="font-size:14px;"><span style="font-family:arial,helvetica,sans-serif;">- Still the aggressive traders may sell some of their portfolios if they get an exit point to find another support level as an entry point in near future.</span></span></li>
</ul>
<p>
<span style="font-size:14px;"><span style="font-family:arial,helvetica,sans-serif;"><strong>Fundamental Outlook:</strong></span></span></p>
<ul>
<li>
<span style="font-size:14px;"><span style="font-family:arial,helvetica,sans-serif;">- The liquidity crisis in Banks seems still persisting and this has been major factor to affect the stock market in negative prices.</span></span></li>
<li>
<span style="font-size:14px;"><span style="font-family:arial,helvetica,sans-serif;">- Government is in verge to review the half annually performances of the current fiscal year. If government shows a probability to spend on the expenditures, the liquidity problem for the short period would be eased to relax the stock market for a price growth.</span></span></li>
<li>
<span style="font-size:14px;"><span style="font-family:arial,helvetica,sans-serif;">- The brokers’ branches out of Kathmandu may not only add the number of traders but may add the value too as a positive effect on market for the price elevation.</span></span></li>
</ul>
<p>
<span style="font-family:arial,helvetica,sans-serif;">Happy Trading……..!!!!!</span></p>
<p>
<img alt="" src="/app/webroot/userfiles/images/nepse.jpg" style="width: 500px; height: 395px;" /></p>
<p>
<strong><span style="font-size:14px;"><span style="font-family:arial,helvetica,sans-serif;">Nepse Daily Candle Chart Illustrates:</span></span></strong></p>
<ol>
<li>
<span style="font-size:14px;"><span style="font-family:arial,helvetica,sans-serif;">- A small green after two consecutive red. Is it harami candle stick pattern?</span></span></li>
<li>
<span style="font-size:14px;"><span style="font-family:arial,helvetica,sans-serif;">- Market inside a triangle where support lies at 1143.9 and resistant at level 1163.02</span></span></li>
<li>
<span style="font-size:14px;"><span style="font-family:arial,helvetica,sans-serif;">- If the trading volume rises with bullish mindset of investors market may target the weekly pivot value 1162 level.</span></span></li>
<li>
<span style="font-size:14px;"><span style="font-family:arial,helvetica,sans-serif;">- If market does not show a sign of recovery then market shall break the current support level to find a new low.</span></span></li>
</ol>
<p>
<img alt="" src="/app/webroot/userfiles/images/sens.jpg" style="width: 500px; height: 419px;" /></p>
<p>
<strong><span style="font-size:14px;"><span style="font-family:arial,helvetica,sans-serif;">Sensitive index daily candle chart illustrates:</span></span></strong></p>
<ol>
<li>
<span style="font-size:14px;"><span style="font-family:arial,helvetica,sans-serif;">- Tomorrows supports are 243.01 and 241.24</span></span></li>
<li>
<span style="font-size:14px;"><span style="font-family:arial,helvetica,sans-serif;">- The resistant value exists at 245.14</span></span></li>
</ol>
<p>
<img alt="" src="/app/webroot/userfiles/images/mindsnepal%281%29.jpg" style="width: 300px; height: 133px;" /></p>
<p>
<strong><em>Disclaimer:</em></strong></p>
<p>
<em>The information contained herein does not purport to be comprehensive and is strictly for information purposes only. It should not be regarded as investment/trading/financial advice. All the information is believed to come from reliable sources.</em></p>
<p>
</p>
<p>
</p>
',
'published' => true,
'created' => '2019-02-05',
'modified' => '2019-02-05',
'keywords' => '',
'description' => '',
'sortorder' => '9741',
'image' => '20190205051944_nepse 21magh.jpg',
'article_date' => '2019-02-05 00:00:00',
'homepage' => true,
'breaking_news' => false,
'main_news' => false,
'in_scroller' => false,
'user_id' => '22'
),
'ArticleCategory' => array(
'id' => '1',
'name' => 'NEWS',
'parentOf' => '0',
'published' => true,
'registered' => '2015-07-20 00:00:00',
'sortorder' => '158',
'del_flag' => '0',
'homepage' => true,
'display_in_menu' => true,
'user_id' => '1',
'created' => '0000-00-00 00:00:00',
'modified' => '2018-11-22 11:58:49'
),
'User' => array(
'password' => '*****',
'id' => '22',
'user_detail_id' => '1',
'group_id' => '24',
'username' => 'kishor.bam@newbusinessage.com',
'name' => '',
'email' => 'kishor.bam@newbusinessage.com',
'address' => '',
'gender' => '',
'access' => '1',
'phone' => '',
'access_type' => '0',
'activated' => false,
'sortorder' => '0',
'published' => '0',
'created' => '2018-11-30 10:47:22',
'last_login' => '2019-06-09 10:32:40',
'ip' => '202.63.242.112'
),
'ArticleComment' => array(),
'ArticleFeature' => array(),
'ArticleHasAuthor' => array(),
'ArticleHasTag' => array(),
'ArticleView' => array(
(int) 0 => array(
[maximum depth reached]
)
),
'Slider' => array()
),
'current_user' => null,
'logged_in' => false
)
$article = array(
'Article' => array(
'id' => '9971',
'article_category_id' => '1',
'title' => 'Nepse Analysis for 6 Feb.',
'sub_title' => '',
'summary' => 'Today’s trading volume Rs 23.100 crores has been lower as compared to yesterday’s trading volume of Rs 36.436 Crores. ',
'content' => '<p>
<strong>CMP: 1147.10 NEPSE</strong></p>
<p>
<strong>The pivot table for tomorrow (23<sup>rd</sup> Magh)</strong></p>
<table align="left" border="1" cellpadding="0" cellspacing="0" style="width:658px;" width="658">
<tbody>
<tr>
<td style="width:94px;height:23px;">
<p>
<strong>S3</strong></p>
</td>
<td style="width:94px;height:23px;">
<p>
<strong>S2</strong></p>
</td>
<td style="width:94px;height:23px;">
<p>
<strong>S1</strong></p>
</td>
<td style="width:88px;height:23px;">
<p>
<strong>P</strong></p>
</td>
<td style="width:96px;height:23px;">
<p>
<strong>R1</strong></p>
</td>
<td style="width:96px;height:23px;">
<p>
<strong>R2</strong></p>
</td>
<td style="width:96px;height:23px;">
<p>
<strong>R3</strong></p>
</td>
</tr>
<tr>
<td style="width:94px;height:23px;">
<p>
1139.77</p>
</td>
<td style="width:94px;height:23px;">
<p>
1142.02</p>
</td>
<td style="width:94px;height:23px;">
<p>
1144.56</p>
</td>
<td style="width:88px;height:23px;">
<p>
<strong>1146.81</strong></p>
</td>
<td style="width:96px;height:23px;">
<p>
1149.35</p>
</td>
<td style="width:96px;height:23px;">
<p>
1151.60</p>
</td>
<td style="width:96px;height:23px;">
<p>
1154.14</p>
</td>
</tr>
</tbody>
</table>
<p>
</p>
<p>
</p>
<p>
</p>
<p>
</p>
<p>
<span style="font-size:14px;"><span style="font-family:arial,helvetica,sans-serif;">Today’s (22<sup>nd </sup>Magh) volume : Rs 23.100 crores</span></span></p>
<p>
<span style="font-size:14px;"><span style="font-family:arial,helvetica,sans-serif;">Yesterdays (21<sup>st</sup> Magh) volume : Rs 36.436 crores</span></span></p>
<p>
<span style="font-size:14px;"><span style="font-family:arial,helvetica,sans-serif;"><strong>The Trading volume:</strong></span></span></p>
<p>
<span style="font-size:14px;"><span style="font-family:arial,helvetica,sans-serif;">Today’s trading volume Rs 23.100 crores has been lower as compared to yesterday’s trading volume of Rs 36.436 Crores. The trading volume does not show a promising bullish outlook when market has closed green and above the daily pivot.</span></span></p>
<p>
<span style="font-size:14px;"><span style="font-family:arial,helvetica,sans-serif;"><strong>Commentary:</strong></span></span></p>
<ul>
<li>
<span style="font-size:14px;"><span style="font-family:arial,helvetica,sans-serif;">- Market seems finding support and has grown higher than yesterdays close.</span></span></li>
<li>
<span style="font-size:14px;"><span style="font-family:arial,helvetica,sans-serif;">- Current market price 1147.10 is higher than tomorrows pivot 1146.81; that indicates market with further growth.</span></span></li>
<li>
<span style="font-size:14px;"><span style="font-family:arial,helvetica,sans-serif;">- Today market traded in lower volume than the yesterdays.</span></span></li>
</ul>
<p>
<span style="font-size:14px;"><span style="font-family:arial,helvetica,sans-serif;"><strong>Recommendations: </strong></span></span></p>
<ul>
<li>
<span style="font-size:14px;"><span style="font-family:arial,helvetica,sans-serif;">- Market may move up if sustained over the pivot 1146.81 but the lower trading volume today keeps all the analysts and traders in the chaos.</span></span></li>
<li>
<span style="font-size:14px;"><span style="font-family:arial,helvetica,sans-serif;">- If trading volume increases with rise in Nepse value tomorrow, the market may target to the weekly pivot 1164.683 which seems virtual at this time.</span></span></li>
<li>
<span style="font-size:14px;"><span style="font-family:arial,helvetica,sans-serif;">- Still the aggressive traders may sell some of their portfolios if they get an exit point to find another support level as an entry point in near future.</span></span></li>
</ul>
<p>
<span style="font-size:14px;"><span style="font-family:arial,helvetica,sans-serif;"><strong>Fundamental Outlook:</strong></span></span></p>
<ul>
<li>
<span style="font-size:14px;"><span style="font-family:arial,helvetica,sans-serif;">- The liquidity crisis in Banks seems still persisting and this has been major factor to affect the stock market in negative prices.</span></span></li>
<li>
<span style="font-size:14px;"><span style="font-family:arial,helvetica,sans-serif;">- Government is in verge to review the half annually performances of the current fiscal year. If government shows a probability to spend on the expenditures, the liquidity problem for the short period would be eased to relax the stock market for a price growth.</span></span></li>
<li>
<span style="font-size:14px;"><span style="font-family:arial,helvetica,sans-serif;">- The brokers’ branches out of Kathmandu may not only add the number of traders but may add the value too as a positive effect on market for the price elevation.</span></span></li>
</ul>
<p>
<span style="font-family:arial,helvetica,sans-serif;">Happy Trading……..!!!!!</span></p>
<p>
<img alt="" src="/app/webroot/userfiles/images/nepse.jpg" style="width: 500px; height: 395px;" /></p>
<p>
<strong><span style="font-size:14px;"><span style="font-family:arial,helvetica,sans-serif;">Nepse Daily Candle Chart Illustrates:</span></span></strong></p>
<ol>
<li>
<span style="font-size:14px;"><span style="font-family:arial,helvetica,sans-serif;">- A small green after two consecutive red. Is it harami candle stick pattern?</span></span></li>
<li>
<span style="font-size:14px;"><span style="font-family:arial,helvetica,sans-serif;">- Market inside a triangle where support lies at 1143.9 and resistant at level 1163.02</span></span></li>
<li>
<span style="font-size:14px;"><span style="font-family:arial,helvetica,sans-serif;">- If the trading volume rises with bullish mindset of investors market may target the weekly pivot value 1162 level.</span></span></li>
<li>
<span style="font-size:14px;"><span style="font-family:arial,helvetica,sans-serif;">- If market does not show a sign of recovery then market shall break the current support level to find a new low.</span></span></li>
</ol>
<p>
<img alt="" src="/app/webroot/userfiles/images/sens.jpg" style="width: 500px; height: 419px;" /></p>
<p>
<strong><span style="font-size:14px;"><span style="font-family:arial,helvetica,sans-serif;">Sensitive index daily candle chart illustrates:</span></span></strong></p>
<ol>
<li>
<span style="font-size:14px;"><span style="font-family:arial,helvetica,sans-serif;">- Tomorrows supports are 243.01 and 241.24</span></span></li>
<li>
<span style="font-size:14px;"><span style="font-family:arial,helvetica,sans-serif;">- The resistant value exists at 245.14</span></span></li>
</ol>
<p>
<img alt="" src="/app/webroot/userfiles/images/mindsnepal%281%29.jpg" style="width: 300px; height: 133px;" /></p>
<p>
<strong><em>Disclaimer:</em></strong></p>
<p>
<em>The information contained herein does not purport to be comprehensive and is strictly for information purposes only. It should not be regarded as investment/trading/financial advice. All the information is believed to come from reliable sources.</em></p>
<p>
</p>
<p>
</p>
',
'published' => true,
'created' => '2019-02-05',
'modified' => '2019-02-05',
'keywords' => '',
'description' => '',
'sortorder' => '9741',
'image' => '20190205051944_nepse 21magh.jpg',
'article_date' => '2019-02-05 00:00:00',
'homepage' => true,
'breaking_news' => false,
'main_news' => false,
'in_scroller' => false,
'user_id' => '22'
),
'ArticleCategory' => array(
'id' => '1',
'name' => 'NEWS',
'parentOf' => '0',
'published' => true,
'registered' => '2015-07-20 00:00:00',
'sortorder' => '158',
'del_flag' => '0',
'homepage' => true,
'display_in_menu' => true,
'user_id' => '1',
'created' => '0000-00-00 00:00:00',
'modified' => '2018-11-22 11:58:49'
),
'User' => array(
'password' => '*****',
'id' => '22',
'user_detail_id' => '1',
'group_id' => '24',
'username' => 'kishor.bam@newbusinessage.com',
'name' => '',
'email' => 'kishor.bam@newbusinessage.com',
'address' => '',
'gender' => '',
'access' => '1',
'phone' => '',
'access_type' => '0',
'activated' => false,
'sortorder' => '0',
'published' => '0',
'created' => '2018-11-30 10:47:22',
'last_login' => '2019-06-09 10:32:40',
'ip' => '202.63.242.112'
),
'ArticleComment' => array(),
'ArticleFeature' => array(),
'ArticleHasAuthor' => array(),
'ArticleHasTag' => array(),
'ArticleView' => array(
(int) 0 => array(
'article_id' => '9971',
'hit' => '1048'
)
),
'Slider' => array()
)
$current_user = null
$logged_in = false
$xml = false
include - APP/View/Elements/side_bar.ctp, line 133
View::_evaluate() - CORE/Cake/View/View.php, line 971
View::_render() - CORE/Cake/View/View.php, line 933
View::_renderElement() - CORE/Cake/View/View.php, line 1224
View::element() - CORE/Cake/View/View.php, line 418
include - APP/View/Articles/view.ctp, line 391
View::_evaluate() - CORE/Cake/View/View.php, line 971
View::_render() - CORE/Cake/View/View.php, line 933
View::render() - CORE/Cake/View/View.php, line 473
Controller::render() - CORE/Cake/Controller/Controller.php, line 968
Dispatcher::_invoke() - CORE/Cake/Routing/Dispatcher.php, line 200
Dispatcher::dispatch() - CORE/Cake/Routing/Dispatcher.php, line 167
[main] - APP/webroot/index.php, line 117
Warning (2): simplexml_load_file() [<a href='http://php.net/function.simplexml-load-file'>function.simplexml-load-file</a>]: I/O warning : failed to load external entity "" [APP/View/Elements/side_bar.ctp, line 133]
$viewFile = '/var/www/html/newbusinessage.com/app/View/Elements/side_bar.ctp'
$dataForView = array(
'article' => array(
'Article' => array(
'id' => '9971',
'article_category_id' => '1',
'title' => 'Nepse Analysis for 6 Feb.',
'sub_title' => '',
'summary' => 'Today’s trading volume Rs 23.100 crores has been lower as compared to yesterday’s trading volume of Rs 36.436 Crores. ',
'content' => '<p>
<strong>CMP: 1147.10 NEPSE</strong></p>
<p>
<strong>The pivot table for tomorrow (23<sup>rd</sup> Magh)</strong></p>
<table align="left" border="1" cellpadding="0" cellspacing="0" style="width:658px;" width="658">
<tbody>
<tr>
<td style="width:94px;height:23px;">
<p>
<strong>S3</strong></p>
</td>
<td style="width:94px;height:23px;">
<p>
<strong>S2</strong></p>
</td>
<td style="width:94px;height:23px;">
<p>
<strong>S1</strong></p>
</td>
<td style="width:88px;height:23px;">
<p>
<strong>P</strong></p>
</td>
<td style="width:96px;height:23px;">
<p>
<strong>R1</strong></p>
</td>
<td style="width:96px;height:23px;">
<p>
<strong>R2</strong></p>
</td>
<td style="width:96px;height:23px;">
<p>
<strong>R3</strong></p>
</td>
</tr>
<tr>
<td style="width:94px;height:23px;">
<p>
1139.77</p>
</td>
<td style="width:94px;height:23px;">
<p>
1142.02</p>
</td>
<td style="width:94px;height:23px;">
<p>
1144.56</p>
</td>
<td style="width:88px;height:23px;">
<p>
<strong>1146.81</strong></p>
</td>
<td style="width:96px;height:23px;">
<p>
1149.35</p>
</td>
<td style="width:96px;height:23px;">
<p>
1151.60</p>
</td>
<td style="width:96px;height:23px;">
<p>
1154.14</p>
</td>
</tr>
</tbody>
</table>
<p>
</p>
<p>
</p>
<p>
</p>
<p>
</p>
<p>
<span style="font-size:14px;"><span style="font-family:arial,helvetica,sans-serif;">Today’s (22<sup>nd </sup>Magh) volume : Rs 23.100 crores</span></span></p>
<p>
<span style="font-size:14px;"><span style="font-family:arial,helvetica,sans-serif;">Yesterdays (21<sup>st</sup> Magh) volume : Rs 36.436 crores</span></span></p>
<p>
<span style="font-size:14px;"><span style="font-family:arial,helvetica,sans-serif;"><strong>The Trading volume:</strong></span></span></p>
<p>
<span style="font-size:14px;"><span style="font-family:arial,helvetica,sans-serif;">Today’s trading volume Rs 23.100 crores has been lower as compared to yesterday’s trading volume of Rs 36.436 Crores. The trading volume does not show a promising bullish outlook when market has closed green and above the daily pivot.</span></span></p>
<p>
<span style="font-size:14px;"><span style="font-family:arial,helvetica,sans-serif;"><strong>Commentary:</strong></span></span></p>
<ul>
<li>
<span style="font-size:14px;"><span style="font-family:arial,helvetica,sans-serif;">- Market seems finding support and has grown higher than yesterdays close.</span></span></li>
<li>
<span style="font-size:14px;"><span style="font-family:arial,helvetica,sans-serif;">- Current market price 1147.10 is higher than tomorrows pivot 1146.81; that indicates market with further growth.</span></span></li>
<li>
<span style="font-size:14px;"><span style="font-family:arial,helvetica,sans-serif;">- Today market traded in lower volume than the yesterdays.</span></span></li>
</ul>
<p>
<span style="font-size:14px;"><span style="font-family:arial,helvetica,sans-serif;"><strong>Recommendations: </strong></span></span></p>
<ul>
<li>
<span style="font-size:14px;"><span style="font-family:arial,helvetica,sans-serif;">- Market may move up if sustained over the pivot 1146.81 but the lower trading volume today keeps all the analysts and traders in the chaos.</span></span></li>
<li>
<span style="font-size:14px;"><span style="font-family:arial,helvetica,sans-serif;">- If trading volume increases with rise in Nepse value tomorrow, the market may target to the weekly pivot 1164.683 which seems virtual at this time.</span></span></li>
<li>
<span style="font-size:14px;"><span style="font-family:arial,helvetica,sans-serif;">- Still the aggressive traders may sell some of their portfolios if they get an exit point to find another support level as an entry point in near future.</span></span></li>
</ul>
<p>
<span style="font-size:14px;"><span style="font-family:arial,helvetica,sans-serif;"><strong>Fundamental Outlook:</strong></span></span></p>
<ul>
<li>
<span style="font-size:14px;"><span style="font-family:arial,helvetica,sans-serif;">- The liquidity crisis in Banks seems still persisting and this has been major factor to affect the stock market in negative prices.</span></span></li>
<li>
<span style="font-size:14px;"><span style="font-family:arial,helvetica,sans-serif;">- Government is in verge to review the half annually performances of the current fiscal year. If government shows a probability to spend on the expenditures, the liquidity problem for the short period would be eased to relax the stock market for a price growth.</span></span></li>
<li>
<span style="font-size:14px;"><span style="font-family:arial,helvetica,sans-serif;">- The brokers’ branches out of Kathmandu may not only add the number of traders but may add the value too as a positive effect on market for the price elevation.</span></span></li>
</ul>
<p>
<span style="font-family:arial,helvetica,sans-serif;">Happy Trading……..!!!!!</span></p>
<p>
<img alt="" src="/app/webroot/userfiles/images/nepse.jpg" style="width: 500px; height: 395px;" /></p>
<p>
<strong><span style="font-size:14px;"><span style="font-family:arial,helvetica,sans-serif;">Nepse Daily Candle Chart Illustrates:</span></span></strong></p>
<ol>
<li>
<span style="font-size:14px;"><span style="font-family:arial,helvetica,sans-serif;">- A small green after two consecutive red. Is it harami candle stick pattern?</span></span></li>
<li>
<span style="font-size:14px;"><span style="font-family:arial,helvetica,sans-serif;">- Market inside a triangle where support lies at 1143.9 and resistant at level 1163.02</span></span></li>
<li>
<span style="font-size:14px;"><span style="font-family:arial,helvetica,sans-serif;">- If the trading volume rises with bullish mindset of investors market may target the weekly pivot value 1162 level.</span></span></li>
<li>
<span style="font-size:14px;"><span style="font-family:arial,helvetica,sans-serif;">- If market does not show a sign of recovery then market shall break the current support level to find a new low.</span></span></li>
</ol>
<p>
<img alt="" src="/app/webroot/userfiles/images/sens.jpg" style="width: 500px; height: 419px;" /></p>
<p>
<strong><span style="font-size:14px;"><span style="font-family:arial,helvetica,sans-serif;">Sensitive index daily candle chart illustrates:</span></span></strong></p>
<ol>
<li>
<span style="font-size:14px;"><span style="font-family:arial,helvetica,sans-serif;">- Tomorrows supports are 243.01 and 241.24</span></span></li>
<li>
<span style="font-size:14px;"><span style="font-family:arial,helvetica,sans-serif;">- The resistant value exists at 245.14</span></span></li>
</ol>
<p>
<img alt="" src="/app/webroot/userfiles/images/mindsnepal%281%29.jpg" style="width: 300px; height: 133px;" /></p>
<p>
<strong><em>Disclaimer:</em></strong></p>
<p>
<em>The information contained herein does not purport to be comprehensive and is strictly for information purposes only. It should not be regarded as investment/trading/financial advice. All the information is believed to come from reliable sources.</em></p>
<p>
</p>
<p>
</p>
',
'published' => true,
'created' => '2019-02-05',
'modified' => '2019-02-05',
'keywords' => '',
'description' => '',
'sortorder' => '9741',
'image' => '20190205051944_nepse 21magh.jpg',
'article_date' => '2019-02-05 00:00:00',
'homepage' => true,
'breaking_news' => false,
'main_news' => false,
'in_scroller' => false,
'user_id' => '22'
),
'ArticleCategory' => array(
'id' => '1',
'name' => 'NEWS',
'parentOf' => '0',
'published' => true,
'registered' => '2015-07-20 00:00:00',
'sortorder' => '158',
'del_flag' => '0',
'homepage' => true,
'display_in_menu' => true,
'user_id' => '1',
'created' => '0000-00-00 00:00:00',
'modified' => '2018-11-22 11:58:49'
),
'User' => array(
'password' => '*****',
'id' => '22',
'user_detail_id' => '1',
'group_id' => '24',
'username' => 'kishor.bam@newbusinessage.com',
'name' => '',
'email' => 'kishor.bam@newbusinessage.com',
'address' => '',
'gender' => '',
'access' => '1',
'phone' => '',
'access_type' => '0',
'activated' => false,
'sortorder' => '0',
'published' => '0',
'created' => '2018-11-30 10:47:22',
'last_login' => '2019-06-09 10:32:40',
'ip' => '202.63.242.112'
),
'ArticleComment' => array(),
'ArticleFeature' => array(),
'ArticleHasAuthor' => array(),
'ArticleHasTag' => array(),
'ArticleView' => array(
(int) 0 => array(
[maximum depth reached]
)
),
'Slider' => array()
),
'current_user' => null,
'logged_in' => false
)
$article = array(
'Article' => array(
'id' => '9971',
'article_category_id' => '1',
'title' => 'Nepse Analysis for 6 Feb.',
'sub_title' => '',
'summary' => 'Today’s trading volume Rs 23.100 crores has been lower as compared to yesterday’s trading volume of Rs 36.436 Crores. ',
'content' => '<p>
<strong>CMP: 1147.10 NEPSE</strong></p>
<p>
<strong>The pivot table for tomorrow (23<sup>rd</sup> Magh)</strong></p>
<table align="left" border="1" cellpadding="0" cellspacing="0" style="width:658px;" width="658">
<tbody>
<tr>
<td style="width:94px;height:23px;">
<p>
<strong>S3</strong></p>
</td>
<td style="width:94px;height:23px;">
<p>
<strong>S2</strong></p>
</td>
<td style="width:94px;height:23px;">
<p>
<strong>S1</strong></p>
</td>
<td style="width:88px;height:23px;">
<p>
<strong>P</strong></p>
</td>
<td style="width:96px;height:23px;">
<p>
<strong>R1</strong></p>
</td>
<td style="width:96px;height:23px;">
<p>
<strong>R2</strong></p>
</td>
<td style="width:96px;height:23px;">
<p>
<strong>R3</strong></p>
</td>
</tr>
<tr>
<td style="width:94px;height:23px;">
<p>
1139.77</p>
</td>
<td style="width:94px;height:23px;">
<p>
1142.02</p>
</td>
<td style="width:94px;height:23px;">
<p>
1144.56</p>
</td>
<td style="width:88px;height:23px;">
<p>
<strong>1146.81</strong></p>
</td>
<td style="width:96px;height:23px;">
<p>
1149.35</p>
</td>
<td style="width:96px;height:23px;">
<p>
1151.60</p>
</td>
<td style="width:96px;height:23px;">
<p>
1154.14</p>
</td>
</tr>
</tbody>
</table>
<p>
</p>
<p>
</p>
<p>
</p>
<p>
</p>
<p>
<span style="font-size:14px;"><span style="font-family:arial,helvetica,sans-serif;">Today’s (22<sup>nd </sup>Magh) volume : Rs 23.100 crores</span></span></p>
<p>
<span style="font-size:14px;"><span style="font-family:arial,helvetica,sans-serif;">Yesterdays (21<sup>st</sup> Magh) volume : Rs 36.436 crores</span></span></p>
<p>
<span style="font-size:14px;"><span style="font-family:arial,helvetica,sans-serif;"><strong>The Trading volume:</strong></span></span></p>
<p>
<span style="font-size:14px;"><span style="font-family:arial,helvetica,sans-serif;">Today’s trading volume Rs 23.100 crores has been lower as compared to yesterday’s trading volume of Rs 36.436 Crores. The trading volume does not show a promising bullish outlook when market has closed green and above the daily pivot.</span></span></p>
<p>
<span style="font-size:14px;"><span style="font-family:arial,helvetica,sans-serif;"><strong>Commentary:</strong></span></span></p>
<ul>
<li>
<span style="font-size:14px;"><span style="font-family:arial,helvetica,sans-serif;">- Market seems finding support and has grown higher than yesterdays close.</span></span></li>
<li>
<span style="font-size:14px;"><span style="font-family:arial,helvetica,sans-serif;">- Current market price 1147.10 is higher than tomorrows pivot 1146.81; that indicates market with further growth.</span></span></li>
<li>
<span style="font-size:14px;"><span style="font-family:arial,helvetica,sans-serif;">- Today market traded in lower volume than the yesterdays.</span></span></li>
</ul>
<p>
<span style="font-size:14px;"><span style="font-family:arial,helvetica,sans-serif;"><strong>Recommendations: </strong></span></span></p>
<ul>
<li>
<span style="font-size:14px;"><span style="font-family:arial,helvetica,sans-serif;">- Market may move up if sustained over the pivot 1146.81 but the lower trading volume today keeps all the analysts and traders in the chaos.</span></span></li>
<li>
<span style="font-size:14px;"><span style="font-family:arial,helvetica,sans-serif;">- If trading volume increases with rise in Nepse value tomorrow, the market may target to the weekly pivot 1164.683 which seems virtual at this time.</span></span></li>
<li>
<span style="font-size:14px;"><span style="font-family:arial,helvetica,sans-serif;">- Still the aggressive traders may sell some of their portfolios if they get an exit point to find another support level as an entry point in near future.</span></span></li>
</ul>
<p>
<span style="font-size:14px;"><span style="font-family:arial,helvetica,sans-serif;"><strong>Fundamental Outlook:</strong></span></span></p>
<ul>
<li>
<span style="font-size:14px;"><span style="font-family:arial,helvetica,sans-serif;">- The liquidity crisis in Banks seems still persisting and this has been major factor to affect the stock market in negative prices.</span></span></li>
<li>
<span style="font-size:14px;"><span style="font-family:arial,helvetica,sans-serif;">- Government is in verge to review the half annually performances of the current fiscal year. If government shows a probability to spend on the expenditures, the liquidity problem for the short period would be eased to relax the stock market for a price growth.</span></span></li>
<li>
<span style="font-size:14px;"><span style="font-family:arial,helvetica,sans-serif;">- The brokers’ branches out of Kathmandu may not only add the number of traders but may add the value too as a positive effect on market for the price elevation.</span></span></li>
</ul>
<p>
<span style="font-family:arial,helvetica,sans-serif;">Happy Trading……..!!!!!</span></p>
<p>
<img alt="" src="/app/webroot/userfiles/images/nepse.jpg" style="width: 500px; height: 395px;" /></p>
<p>
<strong><span style="font-size:14px;"><span style="font-family:arial,helvetica,sans-serif;">Nepse Daily Candle Chart Illustrates:</span></span></strong></p>
<ol>
<li>
<span style="font-size:14px;"><span style="font-family:arial,helvetica,sans-serif;">- A small green after two consecutive red. Is it harami candle stick pattern?</span></span></li>
<li>
<span style="font-size:14px;"><span style="font-family:arial,helvetica,sans-serif;">- Market inside a triangle where support lies at 1143.9 and resistant at level 1163.02</span></span></li>
<li>
<span style="font-size:14px;"><span style="font-family:arial,helvetica,sans-serif;">- If the trading volume rises with bullish mindset of investors market may target the weekly pivot value 1162 level.</span></span></li>
<li>
<span style="font-size:14px;"><span style="font-family:arial,helvetica,sans-serif;">- If market does not show a sign of recovery then market shall break the current support level to find a new low.</span></span></li>
</ol>
<p>
<img alt="" src="/app/webroot/userfiles/images/sens.jpg" style="width: 500px; height: 419px;" /></p>
<p>
<strong><span style="font-size:14px;"><span style="font-family:arial,helvetica,sans-serif;">Sensitive index daily candle chart illustrates:</span></span></strong></p>
<ol>
<li>
<span style="font-size:14px;"><span style="font-family:arial,helvetica,sans-serif;">- Tomorrows supports are 243.01 and 241.24</span></span></li>
<li>
<span style="font-size:14px;"><span style="font-family:arial,helvetica,sans-serif;">- The resistant value exists at 245.14</span></span></li>
</ol>
<p>
<img alt="" src="/app/webroot/userfiles/images/mindsnepal%281%29.jpg" style="width: 300px; height: 133px;" /></p>
<p>
<strong><em>Disclaimer:</em></strong></p>
<p>
<em>The information contained herein does not purport to be comprehensive and is strictly for information purposes only. It should not be regarded as investment/trading/financial advice. All the information is believed to come from reliable sources.</em></p>
<p>
</p>
<p>
</p>
',
'published' => true,
'created' => '2019-02-05',
'modified' => '2019-02-05',
'keywords' => '',
'description' => '',
'sortorder' => '9741',
'image' => '20190205051944_nepse 21magh.jpg',
'article_date' => '2019-02-05 00:00:00',
'homepage' => true,
'breaking_news' => false,
'main_news' => false,
'in_scroller' => false,
'user_id' => '22'
),
'ArticleCategory' => array(
'id' => '1',
'name' => 'NEWS',
'parentOf' => '0',
'published' => true,
'registered' => '2015-07-20 00:00:00',
'sortorder' => '158',
'del_flag' => '0',
'homepage' => true,
'display_in_menu' => true,
'user_id' => '1',
'created' => '0000-00-00 00:00:00',
'modified' => '2018-11-22 11:58:49'
),
'User' => array(
'password' => '*****',
'id' => '22',
'user_detail_id' => '1',
'group_id' => '24',
'username' => 'kishor.bam@newbusinessage.com',
'name' => '',
'email' => 'kishor.bam@newbusinessage.com',
'address' => '',
'gender' => '',
'access' => '1',
'phone' => '',
'access_type' => '0',
'activated' => false,
'sortorder' => '0',
'published' => '0',
'created' => '2018-11-30 10:47:22',
'last_login' => '2019-06-09 10:32:40',
'ip' => '202.63.242.112'
),
'ArticleComment' => array(),
'ArticleFeature' => array(),
'ArticleHasAuthor' => array(),
'ArticleHasTag' => array(),
'ArticleView' => array(
(int) 0 => array(
'article_id' => '9971',
'hit' => '1048'
)
),
'Slider' => array()
)
$current_user = null
$logged_in = false
$xml = false
simplexml_load_file - [internal], line ??
include - APP/View/Elements/side_bar.ctp, line 133
View::_evaluate() - CORE/Cake/View/View.php, line 971
View::_render() - CORE/Cake/View/View.php, line 933
View::_renderElement() - CORE/Cake/View/View.php, line 1224
View::element() - CORE/Cake/View/View.php, line 418
include - APP/View/Articles/view.ctp, line 391
View::_evaluate() - CORE/Cake/View/View.php, line 971
View::_render() - CORE/Cake/View/View.php, line 933
View::render() - CORE/Cake/View/View.php, line 473
Controller::render() - CORE/Cake/Controller/Controller.php, line 968
Dispatcher::_invoke() - CORE/Cake/Routing/Dispatcher.php, line 200
Dispatcher::dispatch() - CORE/Cake/Routing/Dispatcher.php, line 167
[main] - APP/webroot/index.php, line 117