$user = $this->Session->read('Auth.User');
//find the group of logged user
$groupId = $user['Group']['id'];
$viewFile = '/var/www/html/newbusinessage.com/app/View/Articles/view.ctp'
$dataForView = array(
'article' => array(
'Article' => array(
'id' => '3295',
'article_category_id' => '1',
'title' => 'Average Nepali Spends Rs 65,000 pa on Consumption',
'sub_title' => '',
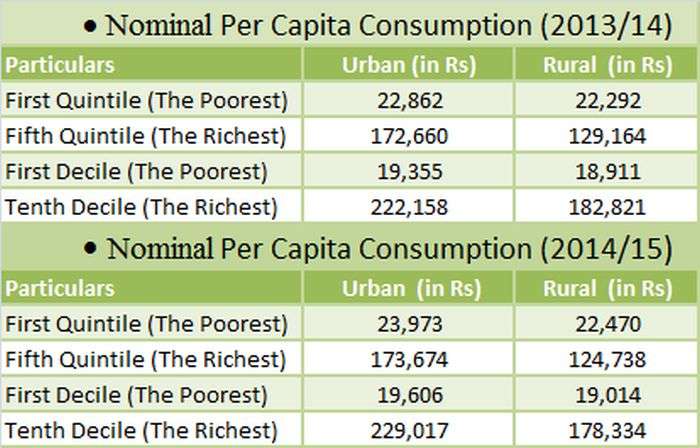
'summary' => 'April 10: An average Nepali spends Rs 64,941 in consumption in a year, finds a research by Central Bureau of Statistics (CBS). According to the Household Consumption Survey 2071/72 conducted by CBS during October 2014 to June 2015, the persons in first quintile (the poorest) spend Rs 22,653 in consumption as compared to Rs 155,000 of those who fall in the fifth quintile (the richest).',
'content' => '<p>April 10: An average Nepali spends Rs 64,941 in consumption in a year, finds a research by Central Bureau of Statistics (CBS). According to the Household Consumption Survey 2071/72 conducted by CBS during October 2014 to June 2015, the persons in first quintile (the poorest) spend Rs 22,653 in consumption as compared to Rs 155,000 of those who fall in the fifth quintile (the richest).</p>
<p>The survey shows that tenth decile (the richest) spend Rs 215,553 while first decile (the poorest) spend Rs 19,068 in annual consumption. In the FY 2070/71, the annual nominal average consumption expenditure of Nepalis was Rs 62,432. As per the survey, a big gap is seen between consumption of first quintile (the poorest) and fifth quintile (the richest). Similarly, the gap is even wider between consumption of first decile (the poorest) and tenth decile (the richest).</p>
<p>In the FY 2070/71, consumption expenditure of the poorest in first quintile was Rs 22,309 while it was Rs 150,710 for the richest of fifth quintile. Similarly, consumption spending of the richest of the tenth decile was seen at Rs 206,454 while, it was Rs 18,923 for the poorest of first decile.</p>
<p>According to the survey, no significant gap between the poorest of urban areas and rural areas is seen. Nevertheless, there is big gap between urban riches and rural riches. The richest of urban and rural areas spend Rs 173,674 and 124,738 respectively, as per the statistics. “Similarly, urban poorest spend Rs 23,873 while rural poorest spend Rs 22,470 in annual consumption,” says Hem Raj Regmi, Deputy Director General of the Bureau.</p>
<p><strong>More spending on food items</strong></p>
<p>As per the survey, annual consumption of Nepalis stands at Rs 1.622 trillion. The survey also shows that the highest expenditure is done in food items in total consumption.</p>
<p>In total consumption expenditure, the spending of rural areas and urban areas are at Rs 877 billion and Rs 764.24 billion respectively. The total spending of the first decile of the poorest is at Rs 47.75 billion while it is Rs 538 billion for the tenth decile of the richest.</p>
<p>Every Nepali spends a nominal of Rs 33,090 in consumption of items such as food stuffs, meats, egg and milks, ghee, oil, fruits, vegetables and various types of beverages along with tobacco and alcoholic products. Apart from food items, expenditure on other consumable goods is high in urban areas and relatively low in rural areas. “Consumption is less costly in rural areas compared to urban areas as consumers in villages have their own productions besides minimal house rent,” says Regmi. Among such expenditure, per capita spending in urban area is Rs 38,437 and Rs 30,727 in rural area.</p>
<p>In FY 2070/71, per capita spending of Nepalis was recorded at Rs 31,008 in food items. According to the CBS report, a difference of Rs 10,000 exists in the consumption of food stuffs in urban and rural areas. In the urban area, per capita expenditure in food items totals Rs 39,473 while, it is Rs 29,260 in the rural area.</p>
<p>Similarly, In FY 2071/72, per capita spending in healthcare, education, jewelry, social security, insurance, banking services along with administrative costs totaled Rs 24,430. As per the survey, such expenses in urban areas and rural areas are at Rs 38,347 and Rs 18,323 respectively.</p>
<p> </p>
',
'published' => true,
'created' => '2016-04-10',
'modified' => '2016-04-10',
'keywords' => '',
'description' => '',
'sortorder' => '3133',
'image' => '20160410052709_table 2.jpg',
'article_date' => '2016-04-10 00:00:00',
'homepage' => false,
'breaking_news' => false,
'main_news' => true,
'in_scroller' => false,
'user_id' => '16'
),
'ArticleCategory' => array(
'id' => '1',
'name' => 'NEWS',
'parentOf' => '0',
'published' => true,
'registered' => '2015-07-20 00:00:00',
'sortorder' => '158',
'del_flag' => '0',
'homepage' => true,
'display_in_menu' => true,
'user_id' => '1',
'created' => '0000-00-00 00:00:00',
'modified' => '2018-11-22 11:58:49'
),
'User' => array(
'password' => '*****',
'id' => '16',
'user_detail_id' => '0',
'group_id' => '1',
'username' => 'anmaharjan@newbusinessage.com',
'name' => '',
'email' => 'anmaharjan@newbusinessage.com',
'address' => '',
'gender' => '',
'access' => '1',
'phone' => '',
'access_type' => '0',
'activated' => false,
'sortorder' => '0',
'published' => '0',
'created' => '2016-04-04 17:02:17',
'last_login' => '2018-09-17 11:47:56',
'ip' => '202.63.242.112'
),
'ArticleComment' => array(),
'ArticleFeature' => array(),
'ArticleHasAuthor' => array(),
'ArticleHasTag' => array(),
'ArticleView' => array(
(int) 0 => array(
[maximum depth reached]
)
),
'Slider' => array()
),
'current_user' => null,
'logged_in' => false
)
$article = array(
'Article' => array(
'id' => '3295',
'article_category_id' => '1',
'title' => 'Average Nepali Spends Rs 65,000 pa on Consumption',
'sub_title' => '',
'summary' => 'April 10: An average Nepali spends Rs 64,941 in consumption in a year, finds a research by Central Bureau of Statistics (CBS). According to the Household Consumption Survey 2071/72 conducted by CBS during October 2014 to June 2015, the persons in first quintile (the poorest) spend Rs 22,653 in consumption as compared to Rs 155,000 of those who fall in the fifth quintile (the richest).',
'content' => '<p>April 10: An average Nepali spends Rs 64,941 in consumption in a year, finds a research by Central Bureau of Statistics (CBS). According to the Household Consumption Survey 2071/72 conducted by CBS during October 2014 to June 2015, the persons in first quintile (the poorest) spend Rs 22,653 in consumption as compared to Rs 155,000 of those who fall in the fifth quintile (the richest).</p>
<p>The survey shows that tenth decile (the richest) spend Rs 215,553 while first decile (the poorest) spend Rs 19,068 in annual consumption. In the FY 2070/71, the annual nominal average consumption expenditure of Nepalis was Rs 62,432. As per the survey, a big gap is seen between consumption of first quintile (the poorest) and fifth quintile (the richest). Similarly, the gap is even wider between consumption of first decile (the poorest) and tenth decile (the richest).</p>
<p>In the FY 2070/71, consumption expenditure of the poorest in first quintile was Rs 22,309 while it was Rs 150,710 for the richest of fifth quintile. Similarly, consumption spending of the richest of the tenth decile was seen at Rs 206,454 while, it was Rs 18,923 for the poorest of first decile.</p>
<p>According to the survey, no significant gap between the poorest of urban areas and rural areas is seen. Nevertheless, there is big gap between urban riches and rural riches. The richest of urban and rural areas spend Rs 173,674 and 124,738 respectively, as per the statistics. “Similarly, urban poorest spend Rs 23,873 while rural poorest spend Rs 22,470 in annual consumption,” says Hem Raj Regmi, Deputy Director General of the Bureau.</p>
<p><strong>More spending on food items</strong></p>
<p>As per the survey, annual consumption of Nepalis stands at Rs 1.622 trillion. The survey also shows that the highest expenditure is done in food items in total consumption.</p>
<p>In total consumption expenditure, the spending of rural areas and urban areas are at Rs 877 billion and Rs 764.24 billion respectively. The total spending of the first decile of the poorest is at Rs 47.75 billion while it is Rs 538 billion for the tenth decile of the richest.</p>
<p>Every Nepali spends a nominal of Rs 33,090 in consumption of items such as food stuffs, meats, egg and milks, ghee, oil, fruits, vegetables and various types of beverages along with tobacco and alcoholic products. Apart from food items, expenditure on other consumable goods is high in urban areas and relatively low in rural areas. “Consumption is less costly in rural areas compared to urban areas as consumers in villages have their own productions besides minimal house rent,” says Regmi. Among such expenditure, per capita spending in urban area is Rs 38,437 and Rs 30,727 in rural area.</p>
<p>In FY 2070/71, per capita spending of Nepalis was recorded at Rs 31,008 in food items. According to the CBS report, a difference of Rs 10,000 exists in the consumption of food stuffs in urban and rural areas. In the urban area, per capita expenditure in food items totals Rs 39,473 while, it is Rs 29,260 in the rural area.</p>
<p>Similarly, In FY 2071/72, per capita spending in healthcare, education, jewelry, social security, insurance, banking services along with administrative costs totaled Rs 24,430. As per the survey, such expenses in urban areas and rural areas are at Rs 38,347 and Rs 18,323 respectively.</p>
<p> </p>
',
'published' => true,
'created' => '2016-04-10',
'modified' => '2016-04-10',
'keywords' => '',
'description' => '',
'sortorder' => '3133',
'image' => '20160410052709_table 2.jpg',
'article_date' => '2016-04-10 00:00:00',
'homepage' => false,
'breaking_news' => false,
'main_news' => true,
'in_scroller' => false,
'user_id' => '16'
),
'ArticleCategory' => array(
'id' => '1',
'name' => 'NEWS',
'parentOf' => '0',
'published' => true,
'registered' => '2015-07-20 00:00:00',
'sortorder' => '158',
'del_flag' => '0',
'homepage' => true,
'display_in_menu' => true,
'user_id' => '1',
'created' => '0000-00-00 00:00:00',
'modified' => '2018-11-22 11:58:49'
),
'User' => array(
'password' => '*****',
'id' => '16',
'user_detail_id' => '0',
'group_id' => '1',
'username' => 'anmaharjan@newbusinessage.com',
'name' => '',
'email' => 'anmaharjan@newbusinessage.com',
'address' => '',
'gender' => '',
'access' => '1',
'phone' => '',
'access_type' => '0',
'activated' => false,
'sortorder' => '0',
'published' => '0',
'created' => '2016-04-04 17:02:17',
'last_login' => '2018-09-17 11:47:56',
'ip' => '202.63.242.112'
),
'ArticleComment' => array(),
'ArticleFeature' => array(),
'ArticleHasAuthor' => array(),
'ArticleHasTag' => array(),
'ArticleView' => array(
(int) 0 => array(
'article_id' => '3295',
'hit' => '1378'
)
),
'Slider' => array()
)
$current_user = null
$logged_in = false
$image = 'https://www.old.newbusinessage.com/app/webroot/img/news/20160410052709_table 2.jpg'
$user = null
include - APP/View/Articles/view.ctp, line 115
View::_evaluate() - CORE/Cake/View/View.php, line 971
View::_render() - CORE/Cake/View/View.php, line 933
View::render() - CORE/Cake/View/View.php, line 473
Controller::render() - CORE/Cake/Controller/Controller.php, line 968
Dispatcher::_invoke() - CORE/Cake/Routing/Dispatcher.php, line 200
Dispatcher::dispatch() - CORE/Cake/Routing/Dispatcher.php, line 167
[main] - APP/webroot/index.php, line 117
Notice (8): Trying to access array offset on value of type null [APP/View/Articles/view.ctp, line 115]
$user = $this->Session->read('Auth.User');
//find the group of logged user
$groupId = $user['Group']['id'];
$viewFile = '/var/www/html/newbusinessage.com/app/View/Articles/view.ctp'
$dataForView = array(
'article' => array(
'Article' => array(
'id' => '3295',
'article_category_id' => '1',
'title' => 'Average Nepali Spends Rs 65,000 pa on Consumption',
'sub_title' => '',
'summary' => 'April 10: An average Nepali spends Rs 64,941 in consumption in a year, finds a research by Central Bureau of Statistics (CBS). According to the Household Consumption Survey 2071/72 conducted by CBS during October 2014 to June 2015, the persons in first quintile (the poorest) spend Rs 22,653 in consumption as compared to Rs 155,000 of those who fall in the fifth quintile (the richest).',
'content' => '<p>April 10: An average Nepali spends Rs 64,941 in consumption in a year, finds a research by Central Bureau of Statistics (CBS). According to the Household Consumption Survey 2071/72 conducted by CBS during October 2014 to June 2015, the persons in first quintile (the poorest) spend Rs 22,653 in consumption as compared to Rs 155,000 of those who fall in the fifth quintile (the richest).</p>
<p>The survey shows that tenth decile (the richest) spend Rs 215,553 while first decile (the poorest) spend Rs 19,068 in annual consumption. In the FY 2070/71, the annual nominal average consumption expenditure of Nepalis was Rs 62,432. As per the survey, a big gap is seen between consumption of first quintile (the poorest) and fifth quintile (the richest). Similarly, the gap is even wider between consumption of first decile (the poorest) and tenth decile (the richest).</p>
<p>In the FY 2070/71, consumption expenditure of the poorest in first quintile was Rs 22,309 while it was Rs 150,710 for the richest of fifth quintile. Similarly, consumption spending of the richest of the tenth decile was seen at Rs 206,454 while, it was Rs 18,923 for the poorest of first decile.</p>
<p>According to the survey, no significant gap between the poorest of urban areas and rural areas is seen. Nevertheless, there is big gap between urban riches and rural riches. The richest of urban and rural areas spend Rs 173,674 and 124,738 respectively, as per the statistics. “Similarly, urban poorest spend Rs 23,873 while rural poorest spend Rs 22,470 in annual consumption,” says Hem Raj Regmi, Deputy Director General of the Bureau.</p>
<p><strong>More spending on food items</strong></p>
<p>As per the survey, annual consumption of Nepalis stands at Rs 1.622 trillion. The survey also shows that the highest expenditure is done in food items in total consumption.</p>
<p>In total consumption expenditure, the spending of rural areas and urban areas are at Rs 877 billion and Rs 764.24 billion respectively. The total spending of the first decile of the poorest is at Rs 47.75 billion while it is Rs 538 billion for the tenth decile of the richest.</p>
<p>Every Nepali spends a nominal of Rs 33,090 in consumption of items such as food stuffs, meats, egg and milks, ghee, oil, fruits, vegetables and various types of beverages along with tobacco and alcoholic products. Apart from food items, expenditure on other consumable goods is high in urban areas and relatively low in rural areas. “Consumption is less costly in rural areas compared to urban areas as consumers in villages have their own productions besides minimal house rent,” says Regmi. Among such expenditure, per capita spending in urban area is Rs 38,437 and Rs 30,727 in rural area.</p>
<p>In FY 2070/71, per capita spending of Nepalis was recorded at Rs 31,008 in food items. According to the CBS report, a difference of Rs 10,000 exists in the consumption of food stuffs in urban and rural areas. In the urban area, per capita expenditure in food items totals Rs 39,473 while, it is Rs 29,260 in the rural area.</p>
<p>Similarly, In FY 2071/72, per capita spending in healthcare, education, jewelry, social security, insurance, banking services along with administrative costs totaled Rs 24,430. As per the survey, such expenses in urban areas and rural areas are at Rs 38,347 and Rs 18,323 respectively.</p>
<p> </p>
',
'published' => true,
'created' => '2016-04-10',
'modified' => '2016-04-10',
'keywords' => '',
'description' => '',
'sortorder' => '3133',
'image' => '20160410052709_table 2.jpg',
'article_date' => '2016-04-10 00:00:00',
'homepage' => false,
'breaking_news' => false,
'main_news' => true,
'in_scroller' => false,
'user_id' => '16'
),
'ArticleCategory' => array(
'id' => '1',
'name' => 'NEWS',
'parentOf' => '0',
'published' => true,
'registered' => '2015-07-20 00:00:00',
'sortorder' => '158',
'del_flag' => '0',
'homepage' => true,
'display_in_menu' => true,
'user_id' => '1',
'created' => '0000-00-00 00:00:00',
'modified' => '2018-11-22 11:58:49'
),
'User' => array(
'password' => '*****',
'id' => '16',
'user_detail_id' => '0',
'group_id' => '1',
'username' => 'anmaharjan@newbusinessage.com',
'name' => '',
'email' => 'anmaharjan@newbusinessage.com',
'address' => '',
'gender' => '',
'access' => '1',
'phone' => '',
'access_type' => '0',
'activated' => false,
'sortorder' => '0',
'published' => '0',
'created' => '2016-04-04 17:02:17',
'last_login' => '2018-09-17 11:47:56',
'ip' => '202.63.242.112'
),
'ArticleComment' => array(),
'ArticleFeature' => array(),
'ArticleHasAuthor' => array(),
'ArticleHasTag' => array(),
'ArticleView' => array(
(int) 0 => array(
[maximum depth reached]
)
),
'Slider' => array()
),
'current_user' => null,
'logged_in' => false
)
$article = array(
'Article' => array(
'id' => '3295',
'article_category_id' => '1',
'title' => 'Average Nepali Spends Rs 65,000 pa on Consumption',
'sub_title' => '',
'summary' => 'April 10: An average Nepali spends Rs 64,941 in consumption in a year, finds a research by Central Bureau of Statistics (CBS). According to the Household Consumption Survey 2071/72 conducted by CBS during October 2014 to June 2015, the persons in first quintile (the poorest) spend Rs 22,653 in consumption as compared to Rs 155,000 of those who fall in the fifth quintile (the richest).',
'content' => '<p>April 10: An average Nepali spends Rs 64,941 in consumption in a year, finds a research by Central Bureau of Statistics (CBS). According to the Household Consumption Survey 2071/72 conducted by CBS during October 2014 to June 2015, the persons in first quintile (the poorest) spend Rs 22,653 in consumption as compared to Rs 155,000 of those who fall in the fifth quintile (the richest).</p>
<p>The survey shows that tenth decile (the richest) spend Rs 215,553 while first decile (the poorest) spend Rs 19,068 in annual consumption. In the FY 2070/71, the annual nominal average consumption expenditure of Nepalis was Rs 62,432. As per the survey, a big gap is seen between consumption of first quintile (the poorest) and fifth quintile (the richest). Similarly, the gap is even wider between consumption of first decile (the poorest) and tenth decile (the richest).</p>
<p>In the FY 2070/71, consumption expenditure of the poorest in first quintile was Rs 22,309 while it was Rs 150,710 for the richest of fifth quintile. Similarly, consumption spending of the richest of the tenth decile was seen at Rs 206,454 while, it was Rs 18,923 for the poorest of first decile.</p>
<p>According to the survey, no significant gap between the poorest of urban areas and rural areas is seen. Nevertheless, there is big gap between urban riches and rural riches. The richest of urban and rural areas spend Rs 173,674 and 124,738 respectively, as per the statistics. “Similarly, urban poorest spend Rs 23,873 while rural poorest spend Rs 22,470 in annual consumption,” says Hem Raj Regmi, Deputy Director General of the Bureau.</p>
<p><strong>More spending on food items</strong></p>
<p>As per the survey, annual consumption of Nepalis stands at Rs 1.622 trillion. The survey also shows that the highest expenditure is done in food items in total consumption.</p>
<p>In total consumption expenditure, the spending of rural areas and urban areas are at Rs 877 billion and Rs 764.24 billion respectively. The total spending of the first decile of the poorest is at Rs 47.75 billion while it is Rs 538 billion for the tenth decile of the richest.</p>
<p>Every Nepali spends a nominal of Rs 33,090 in consumption of items such as food stuffs, meats, egg and milks, ghee, oil, fruits, vegetables and various types of beverages along with tobacco and alcoholic products. Apart from food items, expenditure on other consumable goods is high in urban areas and relatively low in rural areas. “Consumption is less costly in rural areas compared to urban areas as consumers in villages have their own productions besides minimal house rent,” says Regmi. Among such expenditure, per capita spending in urban area is Rs 38,437 and Rs 30,727 in rural area.</p>
<p>In FY 2070/71, per capita spending of Nepalis was recorded at Rs 31,008 in food items. According to the CBS report, a difference of Rs 10,000 exists in the consumption of food stuffs in urban and rural areas. In the urban area, per capita expenditure in food items totals Rs 39,473 while, it is Rs 29,260 in the rural area.</p>
<p>Similarly, In FY 2071/72, per capita spending in healthcare, education, jewelry, social security, insurance, banking services along with administrative costs totaled Rs 24,430. As per the survey, such expenses in urban areas and rural areas are at Rs 38,347 and Rs 18,323 respectively.</p>
<p> </p>
',
'published' => true,
'created' => '2016-04-10',
'modified' => '2016-04-10',
'keywords' => '',
'description' => '',
'sortorder' => '3133',
'image' => '20160410052709_table 2.jpg',
'article_date' => '2016-04-10 00:00:00',
'homepage' => false,
'breaking_news' => false,
'main_news' => true,
'in_scroller' => false,
'user_id' => '16'
),
'ArticleCategory' => array(
'id' => '1',
'name' => 'NEWS',
'parentOf' => '0',
'published' => true,
'registered' => '2015-07-20 00:00:00',
'sortorder' => '158',
'del_flag' => '0',
'homepage' => true,
'display_in_menu' => true,
'user_id' => '1',
'created' => '0000-00-00 00:00:00',
'modified' => '2018-11-22 11:58:49'
),
'User' => array(
'password' => '*****',
'id' => '16',
'user_detail_id' => '0',
'group_id' => '1',
'username' => 'anmaharjan@newbusinessage.com',
'name' => '',
'email' => 'anmaharjan@newbusinessage.com',
'address' => '',
'gender' => '',
'access' => '1',
'phone' => '',
'access_type' => '0',
'activated' => false,
'sortorder' => '0',
'published' => '0',
'created' => '2016-04-04 17:02:17',
'last_login' => '2018-09-17 11:47:56',
'ip' => '202.63.242.112'
),
'ArticleComment' => array(),
'ArticleFeature' => array(),
'ArticleHasAuthor' => array(),
'ArticleHasTag' => array(),
'ArticleView' => array(
(int) 0 => array(
'article_id' => '3295',
'hit' => '1378'
)
),
'Slider' => array()
)
$current_user = null
$logged_in = false
$image = 'https://www.old.newbusinessage.com/app/webroot/img/news/20160410052709_table 2.jpg'
$user = null
include - APP/View/Articles/view.ctp, line 115
View::_evaluate() - CORE/Cake/View/View.php, line 971
View::_render() - CORE/Cake/View/View.php, line 933
View::render() - CORE/Cake/View/View.php, line 473
Controller::render() - CORE/Cake/Controller/Controller.php, line 968
Dispatcher::_invoke() - CORE/Cake/Routing/Dispatcher.php, line 200
Dispatcher::dispatch() - CORE/Cake/Routing/Dispatcher.php, line 167
[main] - APP/webroot/index.php, line 117
Notice (8): Trying to access array offset on value of type null [APP/View/Articles/view.ctp, line 116]
//find the group of logged user
$groupId = $user['Group']['id'];
$user_id=$user["id"];
$viewFile = '/var/www/html/newbusinessage.com/app/View/Articles/view.ctp'
$dataForView = array(
'article' => array(
'Article' => array(
'id' => '3295',
'article_category_id' => '1',
'title' => 'Average Nepali Spends Rs 65,000 pa on Consumption',
'sub_title' => '',
'summary' => 'April 10: An average Nepali spends Rs 64,941 in consumption in a year, finds a research by Central Bureau of Statistics (CBS). According to the Household Consumption Survey 2071/72 conducted by CBS during October 2014 to June 2015, the persons in first quintile (the poorest) spend Rs 22,653 in consumption as compared to Rs 155,000 of those who fall in the fifth quintile (the richest).',
'content' => '<p>April 10: An average Nepali spends Rs 64,941 in consumption in a year, finds a research by Central Bureau of Statistics (CBS). According to the Household Consumption Survey 2071/72 conducted by CBS during October 2014 to June 2015, the persons in first quintile (the poorest) spend Rs 22,653 in consumption as compared to Rs 155,000 of those who fall in the fifth quintile (the richest).</p>
<p>The survey shows that tenth decile (the richest) spend Rs 215,553 while first decile (the poorest) spend Rs 19,068 in annual consumption. In the FY 2070/71, the annual nominal average consumption expenditure of Nepalis was Rs 62,432. As per the survey, a big gap is seen between consumption of first quintile (the poorest) and fifth quintile (the richest). Similarly, the gap is even wider between consumption of first decile (the poorest) and tenth decile (the richest).</p>
<p>In the FY 2070/71, consumption expenditure of the poorest in first quintile was Rs 22,309 while it was Rs 150,710 for the richest of fifth quintile. Similarly, consumption spending of the richest of the tenth decile was seen at Rs 206,454 while, it was Rs 18,923 for the poorest of first decile.</p>
<p>According to the survey, no significant gap between the poorest of urban areas and rural areas is seen. Nevertheless, there is big gap between urban riches and rural riches. The richest of urban and rural areas spend Rs 173,674 and 124,738 respectively, as per the statistics. “Similarly, urban poorest spend Rs 23,873 while rural poorest spend Rs 22,470 in annual consumption,” says Hem Raj Regmi, Deputy Director General of the Bureau.</p>
<p><strong>More spending on food items</strong></p>
<p>As per the survey, annual consumption of Nepalis stands at Rs 1.622 trillion. The survey also shows that the highest expenditure is done in food items in total consumption.</p>
<p>In total consumption expenditure, the spending of rural areas and urban areas are at Rs 877 billion and Rs 764.24 billion respectively. The total spending of the first decile of the poorest is at Rs 47.75 billion while it is Rs 538 billion for the tenth decile of the richest.</p>
<p>Every Nepali spends a nominal of Rs 33,090 in consumption of items such as food stuffs, meats, egg and milks, ghee, oil, fruits, vegetables and various types of beverages along with tobacco and alcoholic products. Apart from food items, expenditure on other consumable goods is high in urban areas and relatively low in rural areas. “Consumption is less costly in rural areas compared to urban areas as consumers in villages have their own productions besides minimal house rent,” says Regmi. Among such expenditure, per capita spending in urban area is Rs 38,437 and Rs 30,727 in rural area.</p>
<p>In FY 2070/71, per capita spending of Nepalis was recorded at Rs 31,008 in food items. According to the CBS report, a difference of Rs 10,000 exists in the consumption of food stuffs in urban and rural areas. In the urban area, per capita expenditure in food items totals Rs 39,473 while, it is Rs 29,260 in the rural area.</p>
<p>Similarly, In FY 2071/72, per capita spending in healthcare, education, jewelry, social security, insurance, banking services along with administrative costs totaled Rs 24,430. As per the survey, such expenses in urban areas and rural areas are at Rs 38,347 and Rs 18,323 respectively.</p>
<p> </p>
',
'published' => true,
'created' => '2016-04-10',
'modified' => '2016-04-10',
'keywords' => '',
'description' => '',
'sortorder' => '3133',
'image' => '20160410052709_table 2.jpg',
'article_date' => '2016-04-10 00:00:00',
'homepage' => false,
'breaking_news' => false,
'main_news' => true,
'in_scroller' => false,
'user_id' => '16'
),
'ArticleCategory' => array(
'id' => '1',
'name' => 'NEWS',
'parentOf' => '0',
'published' => true,
'registered' => '2015-07-20 00:00:00',
'sortorder' => '158',
'del_flag' => '0',
'homepage' => true,
'display_in_menu' => true,
'user_id' => '1',
'created' => '0000-00-00 00:00:00',
'modified' => '2018-11-22 11:58:49'
),
'User' => array(
'password' => '*****',
'id' => '16',
'user_detail_id' => '0',
'group_id' => '1',
'username' => 'anmaharjan@newbusinessage.com',
'name' => '',
'email' => 'anmaharjan@newbusinessage.com',
'address' => '',
'gender' => '',
'access' => '1',
'phone' => '',
'access_type' => '0',
'activated' => false,
'sortorder' => '0',
'published' => '0',
'created' => '2016-04-04 17:02:17',
'last_login' => '2018-09-17 11:47:56',
'ip' => '202.63.242.112'
),
'ArticleComment' => array(),
'ArticleFeature' => array(),
'ArticleHasAuthor' => array(),
'ArticleHasTag' => array(),
'ArticleView' => array(
(int) 0 => array(
[maximum depth reached]
)
),
'Slider' => array()
),
'current_user' => null,
'logged_in' => false
)
$article = array(
'Article' => array(
'id' => '3295',
'article_category_id' => '1',
'title' => 'Average Nepali Spends Rs 65,000 pa on Consumption',
'sub_title' => '',
'summary' => 'April 10: An average Nepali spends Rs 64,941 in consumption in a year, finds a research by Central Bureau of Statistics (CBS). According to the Household Consumption Survey 2071/72 conducted by CBS during October 2014 to June 2015, the persons in first quintile (the poorest) spend Rs 22,653 in consumption as compared to Rs 155,000 of those who fall in the fifth quintile (the richest).',
'content' => '<p>April 10: An average Nepali spends Rs 64,941 in consumption in a year, finds a research by Central Bureau of Statistics (CBS). According to the Household Consumption Survey 2071/72 conducted by CBS during October 2014 to June 2015, the persons in first quintile (the poorest) spend Rs 22,653 in consumption as compared to Rs 155,000 of those who fall in the fifth quintile (the richest).</p>
<p>The survey shows that tenth decile (the richest) spend Rs 215,553 while first decile (the poorest) spend Rs 19,068 in annual consumption. In the FY 2070/71, the annual nominal average consumption expenditure of Nepalis was Rs 62,432. As per the survey, a big gap is seen between consumption of first quintile (the poorest) and fifth quintile (the richest). Similarly, the gap is even wider between consumption of first decile (the poorest) and tenth decile (the richest).</p>
<p>In the FY 2070/71, consumption expenditure of the poorest in first quintile was Rs 22,309 while it was Rs 150,710 for the richest of fifth quintile. Similarly, consumption spending of the richest of the tenth decile was seen at Rs 206,454 while, it was Rs 18,923 for the poorest of first decile.</p>
<p>According to the survey, no significant gap between the poorest of urban areas and rural areas is seen. Nevertheless, there is big gap between urban riches and rural riches. The richest of urban and rural areas spend Rs 173,674 and 124,738 respectively, as per the statistics. “Similarly, urban poorest spend Rs 23,873 while rural poorest spend Rs 22,470 in annual consumption,” says Hem Raj Regmi, Deputy Director General of the Bureau.</p>
<p><strong>More spending on food items</strong></p>
<p>As per the survey, annual consumption of Nepalis stands at Rs 1.622 trillion. The survey also shows that the highest expenditure is done in food items in total consumption.</p>
<p>In total consumption expenditure, the spending of rural areas and urban areas are at Rs 877 billion and Rs 764.24 billion respectively. The total spending of the first decile of the poorest is at Rs 47.75 billion while it is Rs 538 billion for the tenth decile of the richest.</p>
<p>Every Nepali spends a nominal of Rs 33,090 in consumption of items such as food stuffs, meats, egg and milks, ghee, oil, fruits, vegetables and various types of beverages along with tobacco and alcoholic products. Apart from food items, expenditure on other consumable goods is high in urban areas and relatively low in rural areas. “Consumption is less costly in rural areas compared to urban areas as consumers in villages have their own productions besides minimal house rent,” says Regmi. Among such expenditure, per capita spending in urban area is Rs 38,437 and Rs 30,727 in rural area.</p>
<p>In FY 2070/71, per capita spending of Nepalis was recorded at Rs 31,008 in food items. According to the CBS report, a difference of Rs 10,000 exists in the consumption of food stuffs in urban and rural areas. In the urban area, per capita expenditure in food items totals Rs 39,473 while, it is Rs 29,260 in the rural area.</p>
<p>Similarly, In FY 2071/72, per capita spending in healthcare, education, jewelry, social security, insurance, banking services along with administrative costs totaled Rs 24,430. As per the survey, such expenses in urban areas and rural areas are at Rs 38,347 and Rs 18,323 respectively.</p>
<p> </p>
',
'published' => true,
'created' => '2016-04-10',
'modified' => '2016-04-10',
'keywords' => '',
'description' => '',
'sortorder' => '3133',
'image' => '20160410052709_table 2.jpg',
'article_date' => '2016-04-10 00:00:00',
'homepage' => false,
'breaking_news' => false,
'main_news' => true,
'in_scroller' => false,
'user_id' => '16'
),
'ArticleCategory' => array(
'id' => '1',
'name' => 'NEWS',
'parentOf' => '0',
'published' => true,
'registered' => '2015-07-20 00:00:00',
'sortorder' => '158',
'del_flag' => '0',
'homepage' => true,
'display_in_menu' => true,
'user_id' => '1',
'created' => '0000-00-00 00:00:00',
'modified' => '2018-11-22 11:58:49'
),
'User' => array(
'password' => '*****',
'id' => '16',
'user_detail_id' => '0',
'group_id' => '1',
'username' => 'anmaharjan@newbusinessage.com',
'name' => '',
'email' => 'anmaharjan@newbusinessage.com',
'address' => '',
'gender' => '',
'access' => '1',
'phone' => '',
'access_type' => '0',
'activated' => false,
'sortorder' => '0',
'published' => '0',
'created' => '2016-04-04 17:02:17',
'last_login' => '2018-09-17 11:47:56',
'ip' => '202.63.242.112'
),
'ArticleComment' => array(),
'ArticleFeature' => array(),
'ArticleHasAuthor' => array(),
'ArticleHasTag' => array(),
'ArticleView' => array(
(int) 0 => array(
'article_id' => '3295',
'hit' => '1378'
)
),
'Slider' => array()
)
$current_user = null
$logged_in = false
$image = 'https://www.old.newbusinessage.com/app/webroot/img/news/20160410052709_table 2.jpg'
$user = null
$groupId = null
include - APP/View/Articles/view.ctp, line 116
View::_evaluate() - CORE/Cake/View/View.php, line 971
View::_render() - CORE/Cake/View/View.php, line 933
View::render() - CORE/Cake/View/View.php, line 473
Controller::render() - CORE/Cake/Controller/Controller.php, line 968
Dispatcher::_invoke() - CORE/Cake/Routing/Dispatcher.php, line 200
Dispatcher::dispatch() - CORE/Cake/Routing/Dispatcher.php, line 167
[main] - APP/webroot/index.php, line 117
$viewFile = '/var/www/html/newbusinessage.com/app/View/Articles/view.ctp'
$dataForView = array(
'article' => array(
'Article' => array(
'id' => '3295',
'article_category_id' => '1',
'title' => 'Average Nepali Spends Rs 65,000 pa on Consumption',
'sub_title' => '',
'summary' => 'April 10: An average Nepali spends Rs 64,941 in consumption in a year, finds a research by Central Bureau of Statistics (CBS). According to the Household Consumption Survey 2071/72 conducted by CBS during October 2014 to June 2015, the persons in first quintile (the poorest) spend Rs 22,653 in consumption as compared to Rs 155,000 of those who fall in the fifth quintile (the richest).',
'content' => '<p>April 10: An average Nepali spends Rs 64,941 in consumption in a year, finds a research by Central Bureau of Statistics (CBS). According to the Household Consumption Survey 2071/72 conducted by CBS during October 2014 to June 2015, the persons in first quintile (the poorest) spend Rs 22,653 in consumption as compared to Rs 155,000 of those who fall in the fifth quintile (the richest).</p>
<p>The survey shows that tenth decile (the richest) spend Rs 215,553 while first decile (the poorest) spend Rs 19,068 in annual consumption. In the FY 2070/71, the annual nominal average consumption expenditure of Nepalis was Rs 62,432. As per the survey, a big gap is seen between consumption of first quintile (the poorest) and fifth quintile (the richest). Similarly, the gap is even wider between consumption of first decile (the poorest) and tenth decile (the richest).</p>
<p>In the FY 2070/71, consumption expenditure of the poorest in first quintile was Rs 22,309 while it was Rs 150,710 for the richest of fifth quintile. Similarly, consumption spending of the richest of the tenth decile was seen at Rs 206,454 while, it was Rs 18,923 for the poorest of first decile.</p>
<p>According to the survey, no significant gap between the poorest of urban areas and rural areas is seen. Nevertheless, there is big gap between urban riches and rural riches. The richest of urban and rural areas spend Rs 173,674 and 124,738 respectively, as per the statistics. “Similarly, urban poorest spend Rs 23,873 while rural poorest spend Rs 22,470 in annual consumption,” says Hem Raj Regmi, Deputy Director General of the Bureau.</p>
<p><strong>More spending on food items</strong></p>
<p>As per the survey, annual consumption of Nepalis stands at Rs 1.622 trillion. The survey also shows that the highest expenditure is done in food items in total consumption.</p>
<p>In total consumption expenditure, the spending of rural areas and urban areas are at Rs 877 billion and Rs 764.24 billion respectively. The total spending of the first decile of the poorest is at Rs 47.75 billion while it is Rs 538 billion for the tenth decile of the richest.</p>
<p>Every Nepali spends a nominal of Rs 33,090 in consumption of items such as food stuffs, meats, egg and milks, ghee, oil, fruits, vegetables and various types of beverages along with tobacco and alcoholic products. Apart from food items, expenditure on other consumable goods is high in urban areas and relatively low in rural areas. “Consumption is less costly in rural areas compared to urban areas as consumers in villages have their own productions besides minimal house rent,” says Regmi. Among such expenditure, per capita spending in urban area is Rs 38,437 and Rs 30,727 in rural area.</p>
<p>In FY 2070/71, per capita spending of Nepalis was recorded at Rs 31,008 in food items. According to the CBS report, a difference of Rs 10,000 exists in the consumption of food stuffs in urban and rural areas. In the urban area, per capita expenditure in food items totals Rs 39,473 while, it is Rs 29,260 in the rural area.</p>
<p>Similarly, In FY 2071/72, per capita spending in healthcare, education, jewelry, social security, insurance, banking services along with administrative costs totaled Rs 24,430. As per the survey, such expenses in urban areas and rural areas are at Rs 38,347 and Rs 18,323 respectively.</p>
<p> </p>
',
'published' => true,
'created' => '2016-04-10',
'modified' => '2016-04-10',
'keywords' => '',
'description' => '',
'sortorder' => '3133',
'image' => '20160410052709_table 2.jpg',
'article_date' => '2016-04-10 00:00:00',
'homepage' => false,
'breaking_news' => false,
'main_news' => true,
'in_scroller' => false,
'user_id' => '16'
),
'ArticleCategory' => array(
'id' => '1',
'name' => 'NEWS',
'parentOf' => '0',
'published' => true,
'registered' => '2015-07-20 00:00:00',
'sortorder' => '158',
'del_flag' => '0',
'homepage' => true,
'display_in_menu' => true,
'user_id' => '1',
'created' => '0000-00-00 00:00:00',
'modified' => '2018-11-22 11:58:49'
),
'User' => array(
'password' => '*****',
'id' => '16',
'user_detail_id' => '0',
'group_id' => '1',
'username' => 'anmaharjan@newbusinessage.com',
'name' => '',
'email' => 'anmaharjan@newbusinessage.com',
'address' => '',
'gender' => '',
'access' => '1',
'phone' => '',
'access_type' => '0',
'activated' => false,
'sortorder' => '0',
'published' => '0',
'created' => '2016-04-04 17:02:17',
'last_login' => '2018-09-17 11:47:56',
'ip' => '202.63.242.112'
),
'ArticleComment' => array(),
'ArticleFeature' => array(),
'ArticleHasAuthor' => array(),
'ArticleHasTag' => array(),
'ArticleView' => array(
(int) 0 => array(
[maximum depth reached]
)
),
'Slider' => array()
),
'current_user' => null,
'logged_in' => false
)
$article = array(
'Article' => array(
'id' => '3295',
'article_category_id' => '1',
'title' => 'Average Nepali Spends Rs 65,000 pa on Consumption',
'sub_title' => '',
'summary' => 'April 10: An average Nepali spends Rs 64,941 in consumption in a year, finds a research by Central Bureau of Statistics (CBS). According to the Household Consumption Survey 2071/72 conducted by CBS during October 2014 to June 2015, the persons in first quintile (the poorest) spend Rs 22,653 in consumption as compared to Rs 155,000 of those who fall in the fifth quintile (the richest).',
'content' => '<p>April 10: An average Nepali spends Rs 64,941 in consumption in a year, finds a research by Central Bureau of Statistics (CBS). According to the Household Consumption Survey 2071/72 conducted by CBS during October 2014 to June 2015, the persons in first quintile (the poorest) spend Rs 22,653 in consumption as compared to Rs 155,000 of those who fall in the fifth quintile (the richest).</p>
<p>The survey shows that tenth decile (the richest) spend Rs 215,553 while first decile (the poorest) spend Rs 19,068 in annual consumption. In the FY 2070/71, the annual nominal average consumption expenditure of Nepalis was Rs 62,432. As per the survey, a big gap is seen between consumption of first quintile (the poorest) and fifth quintile (the richest). Similarly, the gap is even wider between consumption of first decile (the poorest) and tenth decile (the richest).</p>
<p>In the FY 2070/71, consumption expenditure of the poorest in first quintile was Rs 22,309 while it was Rs 150,710 for the richest of fifth quintile. Similarly, consumption spending of the richest of the tenth decile was seen at Rs 206,454 while, it was Rs 18,923 for the poorest of first decile.</p>
<p>According to the survey, no significant gap between the poorest of urban areas and rural areas is seen. Nevertheless, there is big gap between urban riches and rural riches. The richest of urban and rural areas spend Rs 173,674 and 124,738 respectively, as per the statistics. “Similarly, urban poorest spend Rs 23,873 while rural poorest spend Rs 22,470 in annual consumption,” says Hem Raj Regmi, Deputy Director General of the Bureau.</p>
<p><strong>More spending on food items</strong></p>
<p>As per the survey, annual consumption of Nepalis stands at Rs 1.622 trillion. The survey also shows that the highest expenditure is done in food items in total consumption.</p>
<p>In total consumption expenditure, the spending of rural areas and urban areas are at Rs 877 billion and Rs 764.24 billion respectively. The total spending of the first decile of the poorest is at Rs 47.75 billion while it is Rs 538 billion for the tenth decile of the richest.</p>
<p>Every Nepali spends a nominal of Rs 33,090 in consumption of items such as food stuffs, meats, egg and milks, ghee, oil, fruits, vegetables and various types of beverages along with tobacco and alcoholic products. Apart from food items, expenditure on other consumable goods is high in urban areas and relatively low in rural areas. “Consumption is less costly in rural areas compared to urban areas as consumers in villages have their own productions besides minimal house rent,” says Regmi. Among such expenditure, per capita spending in urban area is Rs 38,437 and Rs 30,727 in rural area.</p>
<p>In FY 2070/71, per capita spending of Nepalis was recorded at Rs 31,008 in food items. According to the CBS report, a difference of Rs 10,000 exists in the consumption of food stuffs in urban and rural areas. In the urban area, per capita expenditure in food items totals Rs 39,473 while, it is Rs 29,260 in the rural area.</p>
<p>Similarly, In FY 2071/72, per capita spending in healthcare, education, jewelry, social security, insurance, banking services along with administrative costs totaled Rs 24,430. As per the survey, such expenses in urban areas and rural areas are at Rs 38,347 and Rs 18,323 respectively.</p>
<p> </p>
',
'published' => true,
'created' => '2016-04-10',
'modified' => '2016-04-10',
'keywords' => '',
'description' => '',
'sortorder' => '3133',
'image' => '20160410052709_table 2.jpg',
'article_date' => '2016-04-10 00:00:00',
'homepage' => false,
'breaking_news' => false,
'main_news' => true,
'in_scroller' => false,
'user_id' => '16'
),
'ArticleCategory' => array(
'id' => '1',
'name' => 'NEWS',
'parentOf' => '0',
'published' => true,
'registered' => '2015-07-20 00:00:00',
'sortorder' => '158',
'del_flag' => '0',
'homepage' => true,
'display_in_menu' => true,
'user_id' => '1',
'created' => '0000-00-00 00:00:00',
'modified' => '2018-11-22 11:58:49'
),
'User' => array(
'password' => '*****',
'id' => '16',
'user_detail_id' => '0',
'group_id' => '1',
'username' => 'anmaharjan@newbusinessage.com',
'name' => '',
'email' => 'anmaharjan@newbusinessage.com',
'address' => '',
'gender' => '',
'access' => '1',
'phone' => '',
'access_type' => '0',
'activated' => false,
'sortorder' => '0',
'published' => '0',
'created' => '2016-04-04 17:02:17',
'last_login' => '2018-09-17 11:47:56',
'ip' => '202.63.242.112'
),
'ArticleComment' => array(),
'ArticleFeature' => array(),
'ArticleHasAuthor' => array(),
'ArticleHasTag' => array(),
'ArticleView' => array(
(int) 0 => array(
'article_id' => '3295',
'hit' => '1378'
)
),
'Slider' => array()
)
$current_user = null
$logged_in = false
$image = 'https://www.old.newbusinessage.com/app/webroot/img/news/20160410052709_table 2.jpg'
$user = null
$groupId = null
$user_id = null
$date = '2016-04-10 00:00:00'
$dateFromDatabase = (int) 1460225700
$newDate = 'Apr 10, 2016'
$articleView = array(
'article_id' => '3295',
'hit' => '1378'
)
$word_count = (int) 541
$time_to_read = (float) 2.71
$time_to_read_min = (float) 2
$time_to_read_second = (float) 43
include - APP/View/Articles/view.ctp, line 241
View::_evaluate() - CORE/Cake/View/View.php, line 971
View::_render() - CORE/Cake/View/View.php, line 933
View::render() - CORE/Cake/View/View.php, line 473
Controller::render() - CORE/Cake/Controller/Controller.php, line 968
Dispatcher::_invoke() - CORE/Cake/Routing/Dispatcher.php, line 200
Dispatcher::dispatch() - CORE/Cake/Routing/Dispatcher.php, line 167
[main] - APP/webroot/index.php, line 117
April 10: An average Nepali spends Rs 64,941 in consumption in a year, finds a research by Central Bureau of Statistics (CBS). According to the Household Consumption Survey 2071/72 conducted by CBS during October 2014 to June 2015, the persons in first quintile (the poorest) spend Rs 22,653 in consumption as compared to Rs 155,000 of those who fall in the fifth quintile (the richest).
The survey shows that tenth decile (the richest) spend Rs 215,553 while first decile (the poorest) spend Rs 19,068 in annual consumption. In the FY 2070/71, the annual nominal average consumption expenditure of Nepalis was Rs 62,432. As per the survey, a big gap is seen between consumption of first quintile (the poorest) and fifth quintile (the richest). Similarly, the gap is even wider between consumption of first decile (the poorest) and tenth decile (the richest).
In the FY 2070/71, consumption expenditure of the poorest in first quintile was Rs 22,309 while it was Rs 150,710 for the richest of fifth quintile. Similarly, consumption spending of the richest of the tenth decile was seen at Rs 206,454 while, it was Rs 18,923 for the poorest of first decile.
According to the survey, no significant gap between the poorest of urban areas and rural areas is seen. Nevertheless, there is big gap between urban riches and rural riches. The richest of urban and rural areas spend Rs 173,674 and 124,738 respectively, as per the statistics. “Similarly, urban poorest spend Rs 23,873 while rural poorest spend Rs 22,470 in annual consumption,” says Hem Raj Regmi, Deputy Director General of the Bureau.
More spending on food items
As per the survey, annual consumption of Nepalis stands at Rs 1.622 trillion. The survey also shows that the highest expenditure is done in food items in total consumption.
In total consumption expenditure, the spending of rural areas and urban areas are at Rs 877 billion and Rs 764.24 billion respectively. The total spending of the first decile of the poorest is at Rs 47.75 billion while it is Rs 538 billion for the tenth decile of the richest.
Every Nepali spends a nominal of Rs 33,090 in consumption of items such as food stuffs, meats, egg and milks, ghee, oil, fruits, vegetables and various types of beverages along with tobacco and alcoholic products. Apart from food items, expenditure on other consumable goods is high in urban areas and relatively low in rural areas. “Consumption is less costly in rural areas compared to urban areas as consumers in villages have their own productions besides minimal house rent,” says Regmi. Among such expenditure, per capita spending in urban area is Rs 38,437 and Rs 30,727 in rural area.
In FY 2070/71, per capita spending of Nepalis was recorded at Rs 31,008 in food items. According to the CBS report, a difference of Rs 10,000 exists in the consumption of food stuffs in urban and rural areas. In the urban area, per capita expenditure in food items totals Rs 39,473 while, it is Rs 29,260 in the rural area.
Similarly, In FY 2071/72, per capita spending in healthcare, education, jewelry, social security, insurance, banking services along with administrative costs totaled Rs 24,430. As per the survey, such expenses in urban areas and rural areas are at Rs 38,347 and Rs 18,323 respectively.
FormHelper::create() - CORE/Cake/View/Helper/FormHelper.php, line 383
include - APP/View/Articles/view.ctp, line 273
View::_evaluate() - CORE/Cake/View/View.php, line 971
View::_render() - CORE/Cake/View/View.php, line 933
View::render() - CORE/Cake/View/View.php, line 473
Controller::render() - CORE/Cake/Controller/Controller.php, line 968
Dispatcher::_invoke() - CORE/Cake/Routing/Dispatcher.php, line 200
Dispatcher::dispatch() - CORE/Cake/Routing/Dispatcher.php, line 167
[main] - APP/webroot/index.php, line 117
$viewFile = '/var/www/html/newbusinessage.com/app/View/Elements/side_bar.ctp'
$dataForView = array(
'article' => array(
'Article' => array(
'id' => '3295',
'article_category_id' => '1',
'title' => 'Average Nepali Spends Rs 65,000 pa on Consumption',
'sub_title' => '',
'summary' => 'April 10: An average Nepali spends Rs 64,941 in consumption in a year, finds a research by Central Bureau of Statistics (CBS). According to the Household Consumption Survey 2071/72 conducted by CBS during October 2014 to June 2015, the persons in first quintile (the poorest) spend Rs 22,653 in consumption as compared to Rs 155,000 of those who fall in the fifth quintile (the richest).',
'content' => '<p>April 10: An average Nepali spends Rs 64,941 in consumption in a year, finds a research by Central Bureau of Statistics (CBS). According to the Household Consumption Survey 2071/72 conducted by CBS during October 2014 to June 2015, the persons in first quintile (the poorest) spend Rs 22,653 in consumption as compared to Rs 155,000 of those who fall in the fifth quintile (the richest).</p>
<p>The survey shows that tenth decile (the richest) spend Rs 215,553 while first decile (the poorest) spend Rs 19,068 in annual consumption. In the FY 2070/71, the annual nominal average consumption expenditure of Nepalis was Rs 62,432. As per the survey, a big gap is seen between consumption of first quintile (the poorest) and fifth quintile (the richest). Similarly, the gap is even wider between consumption of first decile (the poorest) and tenth decile (the richest).</p>
<p>In the FY 2070/71, consumption expenditure of the poorest in first quintile was Rs 22,309 while it was Rs 150,710 for the richest of fifth quintile. Similarly, consumption spending of the richest of the tenth decile was seen at Rs 206,454 while, it was Rs 18,923 for the poorest of first decile.</p>
<p>According to the survey, no significant gap between the poorest of urban areas and rural areas is seen. Nevertheless, there is big gap between urban riches and rural riches. The richest of urban and rural areas spend Rs 173,674 and 124,738 respectively, as per the statistics. “Similarly, urban poorest spend Rs 23,873 while rural poorest spend Rs 22,470 in annual consumption,” says Hem Raj Regmi, Deputy Director General of the Bureau.</p>
<p><strong>More spending on food items</strong></p>
<p>As per the survey, annual consumption of Nepalis stands at Rs 1.622 trillion. The survey also shows that the highest expenditure is done in food items in total consumption.</p>
<p>In total consumption expenditure, the spending of rural areas and urban areas are at Rs 877 billion and Rs 764.24 billion respectively. The total spending of the first decile of the poorest is at Rs 47.75 billion while it is Rs 538 billion for the tenth decile of the richest.</p>
<p>Every Nepali spends a nominal of Rs 33,090 in consumption of items such as food stuffs, meats, egg and milks, ghee, oil, fruits, vegetables and various types of beverages along with tobacco and alcoholic products. Apart from food items, expenditure on other consumable goods is high in urban areas and relatively low in rural areas. “Consumption is less costly in rural areas compared to urban areas as consumers in villages have their own productions besides minimal house rent,” says Regmi. Among such expenditure, per capita spending in urban area is Rs 38,437 and Rs 30,727 in rural area.</p>
<p>In FY 2070/71, per capita spending of Nepalis was recorded at Rs 31,008 in food items. According to the CBS report, a difference of Rs 10,000 exists in the consumption of food stuffs in urban and rural areas. In the urban area, per capita expenditure in food items totals Rs 39,473 while, it is Rs 29,260 in the rural area.</p>
<p>Similarly, In FY 2071/72, per capita spending in healthcare, education, jewelry, social security, insurance, banking services along with administrative costs totaled Rs 24,430. As per the survey, such expenses in urban areas and rural areas are at Rs 38,347 and Rs 18,323 respectively.</p>
<p> </p>
',
'published' => true,
'created' => '2016-04-10',
'modified' => '2016-04-10',
'keywords' => '',
'description' => '',
'sortorder' => '3133',
'image' => '20160410052709_table 2.jpg',
'article_date' => '2016-04-10 00:00:00',
'homepage' => false,
'breaking_news' => false,
'main_news' => true,
'in_scroller' => false,
'user_id' => '16'
),
'ArticleCategory' => array(
'id' => '1',
'name' => 'NEWS',
'parentOf' => '0',
'published' => true,
'registered' => '2015-07-20 00:00:00',
'sortorder' => '158',
'del_flag' => '0',
'homepage' => true,
'display_in_menu' => true,
'user_id' => '1',
'created' => '0000-00-00 00:00:00',
'modified' => '2018-11-22 11:58:49'
),
'User' => array(
'password' => '*****',
'id' => '16',
'user_detail_id' => '0',
'group_id' => '1',
'username' => 'anmaharjan@newbusinessage.com',
'name' => '',
'email' => 'anmaharjan@newbusinessage.com',
'address' => '',
'gender' => '',
'access' => '1',
'phone' => '',
'access_type' => '0',
'activated' => false,
'sortorder' => '0',
'published' => '0',
'created' => '2016-04-04 17:02:17',
'last_login' => '2018-09-17 11:47:56',
'ip' => '202.63.242.112'
),
'ArticleComment' => array(),
'ArticleFeature' => array(),
'ArticleHasAuthor' => array(),
'ArticleHasTag' => array(),
'ArticleView' => array(
(int) 0 => array(
[maximum depth reached]
)
),
'Slider' => array()
),
'current_user' => null,
'logged_in' => false
)
$article = array(
'Article' => array(
'id' => '3295',
'article_category_id' => '1',
'title' => 'Average Nepali Spends Rs 65,000 pa on Consumption',
'sub_title' => '',
'summary' => 'April 10: An average Nepali spends Rs 64,941 in consumption in a year, finds a research by Central Bureau of Statistics (CBS). According to the Household Consumption Survey 2071/72 conducted by CBS during October 2014 to June 2015, the persons in first quintile (the poorest) spend Rs 22,653 in consumption as compared to Rs 155,000 of those who fall in the fifth quintile (the richest).',
'content' => '<p>April 10: An average Nepali spends Rs 64,941 in consumption in a year, finds a research by Central Bureau of Statistics (CBS). According to the Household Consumption Survey 2071/72 conducted by CBS during October 2014 to June 2015, the persons in first quintile (the poorest) spend Rs 22,653 in consumption as compared to Rs 155,000 of those who fall in the fifth quintile (the richest).</p>
<p>The survey shows that tenth decile (the richest) spend Rs 215,553 while first decile (the poorest) spend Rs 19,068 in annual consumption. In the FY 2070/71, the annual nominal average consumption expenditure of Nepalis was Rs 62,432. As per the survey, a big gap is seen between consumption of first quintile (the poorest) and fifth quintile (the richest). Similarly, the gap is even wider between consumption of first decile (the poorest) and tenth decile (the richest).</p>
<p>In the FY 2070/71, consumption expenditure of the poorest in first quintile was Rs 22,309 while it was Rs 150,710 for the richest of fifth quintile. Similarly, consumption spending of the richest of the tenth decile was seen at Rs 206,454 while, it was Rs 18,923 for the poorest of first decile.</p>
<p>According to the survey, no significant gap between the poorest of urban areas and rural areas is seen. Nevertheless, there is big gap between urban riches and rural riches. The richest of urban and rural areas spend Rs 173,674 and 124,738 respectively, as per the statistics. “Similarly, urban poorest spend Rs 23,873 while rural poorest spend Rs 22,470 in annual consumption,” says Hem Raj Regmi, Deputy Director General of the Bureau.</p>
<p><strong>More spending on food items</strong></p>
<p>As per the survey, annual consumption of Nepalis stands at Rs 1.622 trillion. The survey also shows that the highest expenditure is done in food items in total consumption.</p>
<p>In total consumption expenditure, the spending of rural areas and urban areas are at Rs 877 billion and Rs 764.24 billion respectively. The total spending of the first decile of the poorest is at Rs 47.75 billion while it is Rs 538 billion for the tenth decile of the richest.</p>
<p>Every Nepali spends a nominal of Rs 33,090 in consumption of items such as food stuffs, meats, egg and milks, ghee, oil, fruits, vegetables and various types of beverages along with tobacco and alcoholic products. Apart from food items, expenditure on other consumable goods is high in urban areas and relatively low in rural areas. “Consumption is less costly in rural areas compared to urban areas as consumers in villages have their own productions besides minimal house rent,” says Regmi. Among such expenditure, per capita spending in urban area is Rs 38,437 and Rs 30,727 in rural area.</p>
<p>In FY 2070/71, per capita spending of Nepalis was recorded at Rs 31,008 in food items. According to the CBS report, a difference of Rs 10,000 exists in the consumption of food stuffs in urban and rural areas. In the urban area, per capita expenditure in food items totals Rs 39,473 while, it is Rs 29,260 in the rural area.</p>
<p>Similarly, In FY 2071/72, per capita spending in healthcare, education, jewelry, social security, insurance, banking services along with administrative costs totaled Rs 24,430. As per the survey, such expenses in urban areas and rural areas are at Rs 38,347 and Rs 18,323 respectively.</p>
<p> </p>
',
'published' => true,
'created' => '2016-04-10',
'modified' => '2016-04-10',
'keywords' => '',
'description' => '',
'sortorder' => '3133',
'image' => '20160410052709_table 2.jpg',
'article_date' => '2016-04-10 00:00:00',
'homepage' => false,
'breaking_news' => false,
'main_news' => true,
'in_scroller' => false,
'user_id' => '16'
),
'ArticleCategory' => array(
'id' => '1',
'name' => 'NEWS',
'parentOf' => '0',
'published' => true,
'registered' => '2015-07-20 00:00:00',
'sortorder' => '158',
'del_flag' => '0',
'homepage' => true,
'display_in_menu' => true,
'user_id' => '1',
'created' => '0000-00-00 00:00:00',
'modified' => '2018-11-22 11:58:49'
),
'User' => array(
'password' => '*****',
'id' => '16',
'user_detail_id' => '0',
'group_id' => '1',
'username' => 'anmaharjan@newbusinessage.com',
'name' => '',
'email' => 'anmaharjan@newbusinessage.com',
'address' => '',
'gender' => '',
'access' => '1',
'phone' => '',
'access_type' => '0',
'activated' => false,
'sortorder' => '0',
'published' => '0',
'created' => '2016-04-04 17:02:17',
'last_login' => '2018-09-17 11:47:56',
'ip' => '202.63.242.112'
),
'ArticleComment' => array(),
'ArticleFeature' => array(),
'ArticleHasAuthor' => array(),
'ArticleHasTag' => array(),
'ArticleView' => array(
(int) 0 => array(
'article_id' => '3295',
'hit' => '1378'
)
),
'Slider' => array()
)
$current_user = null
$logged_in = false
include - APP/View/Elements/side_bar.ctp, line 60
View::_evaluate() - CORE/Cake/View/View.php, line 971
View::_render() - CORE/Cake/View/View.php, line 933
View::_renderElement() - CORE/Cake/View/View.php, line 1224
View::element() - CORE/Cake/View/View.php, line 418
include - APP/View/Articles/view.ctp, line 391
View::_evaluate() - CORE/Cake/View/View.php, line 971
View::_render() - CORE/Cake/View/View.php, line 933
View::render() - CORE/Cake/View/View.php, line 473
Controller::render() - CORE/Cake/Controller/Controller.php, line 968
Dispatcher::_invoke() - CORE/Cake/Routing/Dispatcher.php, line 200
Dispatcher::dispatch() - CORE/Cake/Routing/Dispatcher.php, line 167
[main] - APP/webroot/index.php, line 117
Warning (2): simplexml_load_file() [<a href='http://php.net/function.simplexml-load-file'>function.simplexml-load-file</a>]: I/O warning : failed to load external entity "" [APP/View/Elements/side_bar.ctp, line 60]
$viewFile = '/var/www/html/newbusinessage.com/app/View/Elements/side_bar.ctp'
$dataForView = array(
'article' => array(
'Article' => array(
'id' => '3295',
'article_category_id' => '1',
'title' => 'Average Nepali Spends Rs 65,000 pa on Consumption',
'sub_title' => '',
'summary' => 'April 10: An average Nepali spends Rs 64,941 in consumption in a year, finds a research by Central Bureau of Statistics (CBS). According to the Household Consumption Survey 2071/72 conducted by CBS during October 2014 to June 2015, the persons in first quintile (the poorest) spend Rs 22,653 in consumption as compared to Rs 155,000 of those who fall in the fifth quintile (the richest).',
'content' => '<p>April 10: An average Nepali spends Rs 64,941 in consumption in a year, finds a research by Central Bureau of Statistics (CBS). According to the Household Consumption Survey 2071/72 conducted by CBS during October 2014 to June 2015, the persons in first quintile (the poorest) spend Rs 22,653 in consumption as compared to Rs 155,000 of those who fall in the fifth quintile (the richest).</p>
<p>The survey shows that tenth decile (the richest) spend Rs 215,553 while first decile (the poorest) spend Rs 19,068 in annual consumption. In the FY 2070/71, the annual nominal average consumption expenditure of Nepalis was Rs 62,432. As per the survey, a big gap is seen between consumption of first quintile (the poorest) and fifth quintile (the richest). Similarly, the gap is even wider between consumption of first decile (the poorest) and tenth decile (the richest).</p>
<p>In the FY 2070/71, consumption expenditure of the poorest in first quintile was Rs 22,309 while it was Rs 150,710 for the richest of fifth quintile. Similarly, consumption spending of the richest of the tenth decile was seen at Rs 206,454 while, it was Rs 18,923 for the poorest of first decile.</p>
<p>According to the survey, no significant gap between the poorest of urban areas and rural areas is seen. Nevertheless, there is big gap between urban riches and rural riches. The richest of urban and rural areas spend Rs 173,674 and 124,738 respectively, as per the statistics. “Similarly, urban poorest spend Rs 23,873 while rural poorest spend Rs 22,470 in annual consumption,” says Hem Raj Regmi, Deputy Director General of the Bureau.</p>
<p><strong>More spending on food items</strong></p>
<p>As per the survey, annual consumption of Nepalis stands at Rs 1.622 trillion. The survey also shows that the highest expenditure is done in food items in total consumption.</p>
<p>In total consumption expenditure, the spending of rural areas and urban areas are at Rs 877 billion and Rs 764.24 billion respectively. The total spending of the first decile of the poorest is at Rs 47.75 billion while it is Rs 538 billion for the tenth decile of the richest.</p>
<p>Every Nepali spends a nominal of Rs 33,090 in consumption of items such as food stuffs, meats, egg and milks, ghee, oil, fruits, vegetables and various types of beverages along with tobacco and alcoholic products. Apart from food items, expenditure on other consumable goods is high in urban areas and relatively low in rural areas. “Consumption is less costly in rural areas compared to urban areas as consumers in villages have their own productions besides minimal house rent,” says Regmi. Among such expenditure, per capita spending in urban area is Rs 38,437 and Rs 30,727 in rural area.</p>
<p>In FY 2070/71, per capita spending of Nepalis was recorded at Rs 31,008 in food items. According to the CBS report, a difference of Rs 10,000 exists in the consumption of food stuffs in urban and rural areas. In the urban area, per capita expenditure in food items totals Rs 39,473 while, it is Rs 29,260 in the rural area.</p>
<p>Similarly, In FY 2071/72, per capita spending in healthcare, education, jewelry, social security, insurance, banking services along with administrative costs totaled Rs 24,430. As per the survey, such expenses in urban areas and rural areas are at Rs 38,347 and Rs 18,323 respectively.</p>
<p> </p>
',
'published' => true,
'created' => '2016-04-10',
'modified' => '2016-04-10',
'keywords' => '',
'description' => '',
'sortorder' => '3133',
'image' => '20160410052709_table 2.jpg',
'article_date' => '2016-04-10 00:00:00',
'homepage' => false,
'breaking_news' => false,
'main_news' => true,
'in_scroller' => false,
'user_id' => '16'
),
'ArticleCategory' => array(
'id' => '1',
'name' => 'NEWS',
'parentOf' => '0',
'published' => true,
'registered' => '2015-07-20 00:00:00',
'sortorder' => '158',
'del_flag' => '0',
'homepage' => true,
'display_in_menu' => true,
'user_id' => '1',
'created' => '0000-00-00 00:00:00',
'modified' => '2018-11-22 11:58:49'
),
'User' => array(
'password' => '*****',
'id' => '16',
'user_detail_id' => '0',
'group_id' => '1',
'username' => 'anmaharjan@newbusinessage.com',
'name' => '',
'email' => 'anmaharjan@newbusinessage.com',
'address' => '',
'gender' => '',
'access' => '1',
'phone' => '',
'access_type' => '0',
'activated' => false,
'sortorder' => '0',
'published' => '0',
'created' => '2016-04-04 17:02:17',
'last_login' => '2018-09-17 11:47:56',
'ip' => '202.63.242.112'
),
'ArticleComment' => array(),
'ArticleFeature' => array(),
'ArticleHasAuthor' => array(),
'ArticleHasTag' => array(),
'ArticleView' => array(
(int) 0 => array(
[maximum depth reached]
)
),
'Slider' => array()
),
'current_user' => null,
'logged_in' => false
)
$article = array(
'Article' => array(
'id' => '3295',
'article_category_id' => '1',
'title' => 'Average Nepali Spends Rs 65,000 pa on Consumption',
'sub_title' => '',
'summary' => 'April 10: An average Nepali spends Rs 64,941 in consumption in a year, finds a research by Central Bureau of Statistics (CBS). According to the Household Consumption Survey 2071/72 conducted by CBS during October 2014 to June 2015, the persons in first quintile (the poorest) spend Rs 22,653 in consumption as compared to Rs 155,000 of those who fall in the fifth quintile (the richest).',
'content' => '<p>April 10: An average Nepali spends Rs 64,941 in consumption in a year, finds a research by Central Bureau of Statistics (CBS). According to the Household Consumption Survey 2071/72 conducted by CBS during October 2014 to June 2015, the persons in first quintile (the poorest) spend Rs 22,653 in consumption as compared to Rs 155,000 of those who fall in the fifth quintile (the richest).</p>
<p>The survey shows that tenth decile (the richest) spend Rs 215,553 while first decile (the poorest) spend Rs 19,068 in annual consumption. In the FY 2070/71, the annual nominal average consumption expenditure of Nepalis was Rs 62,432. As per the survey, a big gap is seen between consumption of first quintile (the poorest) and fifth quintile (the richest). Similarly, the gap is even wider between consumption of first decile (the poorest) and tenth decile (the richest).</p>
<p>In the FY 2070/71, consumption expenditure of the poorest in first quintile was Rs 22,309 while it was Rs 150,710 for the richest of fifth quintile. Similarly, consumption spending of the richest of the tenth decile was seen at Rs 206,454 while, it was Rs 18,923 for the poorest of first decile.</p>
<p>According to the survey, no significant gap between the poorest of urban areas and rural areas is seen. Nevertheless, there is big gap between urban riches and rural riches. The richest of urban and rural areas spend Rs 173,674 and 124,738 respectively, as per the statistics. “Similarly, urban poorest spend Rs 23,873 while rural poorest spend Rs 22,470 in annual consumption,” says Hem Raj Regmi, Deputy Director General of the Bureau.</p>
<p><strong>More spending on food items</strong></p>
<p>As per the survey, annual consumption of Nepalis stands at Rs 1.622 trillion. The survey also shows that the highest expenditure is done in food items in total consumption.</p>
<p>In total consumption expenditure, the spending of rural areas and urban areas are at Rs 877 billion and Rs 764.24 billion respectively. The total spending of the first decile of the poorest is at Rs 47.75 billion while it is Rs 538 billion for the tenth decile of the richest.</p>
<p>Every Nepali spends a nominal of Rs 33,090 in consumption of items such as food stuffs, meats, egg and milks, ghee, oil, fruits, vegetables and various types of beverages along with tobacco and alcoholic products. Apart from food items, expenditure on other consumable goods is high in urban areas and relatively low in rural areas. “Consumption is less costly in rural areas compared to urban areas as consumers in villages have their own productions besides minimal house rent,” says Regmi. Among such expenditure, per capita spending in urban area is Rs 38,437 and Rs 30,727 in rural area.</p>
<p>In FY 2070/71, per capita spending of Nepalis was recorded at Rs 31,008 in food items. According to the CBS report, a difference of Rs 10,000 exists in the consumption of food stuffs in urban and rural areas. In the urban area, per capita expenditure in food items totals Rs 39,473 while, it is Rs 29,260 in the rural area.</p>
<p>Similarly, In FY 2071/72, per capita spending in healthcare, education, jewelry, social security, insurance, banking services along with administrative costs totaled Rs 24,430. As per the survey, such expenses in urban areas and rural areas are at Rs 38,347 and Rs 18,323 respectively.</p>
<p> </p>
',
'published' => true,
'created' => '2016-04-10',
'modified' => '2016-04-10',
'keywords' => '',
'description' => '',
'sortorder' => '3133',
'image' => '20160410052709_table 2.jpg',
'article_date' => '2016-04-10 00:00:00',
'homepage' => false,
'breaking_news' => false,
'main_news' => true,
'in_scroller' => false,
'user_id' => '16'
),
'ArticleCategory' => array(
'id' => '1',
'name' => 'NEWS',
'parentOf' => '0',
'published' => true,
'registered' => '2015-07-20 00:00:00',
'sortorder' => '158',
'del_flag' => '0',
'homepage' => true,
'display_in_menu' => true,
'user_id' => '1',
'created' => '0000-00-00 00:00:00',
'modified' => '2018-11-22 11:58:49'
),
'User' => array(
'password' => '*****',
'id' => '16',
'user_detail_id' => '0',
'group_id' => '1',
'username' => 'anmaharjan@newbusinessage.com',
'name' => '',
'email' => 'anmaharjan@newbusinessage.com',
'address' => '',
'gender' => '',
'access' => '1',
'phone' => '',
'access_type' => '0',
'activated' => false,
'sortorder' => '0',
'published' => '0',
'created' => '2016-04-04 17:02:17',
'last_login' => '2018-09-17 11:47:56',
'ip' => '202.63.242.112'
),
'ArticleComment' => array(),
'ArticleFeature' => array(),
'ArticleHasAuthor' => array(),
'ArticleHasTag' => array(),
'ArticleView' => array(
(int) 0 => array(
'article_id' => '3295',
'hit' => '1378'
)
),
'Slider' => array()
)
$current_user = null
$logged_in = false
simplexml_load_file - [internal], line ??
include - APP/View/Elements/side_bar.ctp, line 60
View::_evaluate() - CORE/Cake/View/View.php, line 971
View::_render() - CORE/Cake/View/View.php, line 933
View::_renderElement() - CORE/Cake/View/View.php, line 1224
View::element() - CORE/Cake/View/View.php, line 418
include - APP/View/Articles/view.ctp, line 391
View::_evaluate() - CORE/Cake/View/View.php, line 971
View::_render() - CORE/Cake/View/View.php, line 933
View::render() - CORE/Cake/View/View.php, line 473
Controller::render() - CORE/Cake/Controller/Controller.php, line 968
Dispatcher::_invoke() - CORE/Cake/Routing/Dispatcher.php, line 200
Dispatcher::dispatch() - CORE/Cake/Routing/Dispatcher.php, line 167
[main] - APP/webroot/index.php, line 117
file not found!
Notice (8): Undefined variable: file [APP/View/Elements/side_bar.ctp, line 133]
$viewFile = '/var/www/html/newbusinessage.com/app/View/Elements/side_bar.ctp'
$dataForView = array(
'article' => array(
'Article' => array(
'id' => '3295',
'article_category_id' => '1',
'title' => 'Average Nepali Spends Rs 65,000 pa on Consumption',
'sub_title' => '',
'summary' => 'April 10: An average Nepali spends Rs 64,941 in consumption in a year, finds a research by Central Bureau of Statistics (CBS). According to the Household Consumption Survey 2071/72 conducted by CBS during October 2014 to June 2015, the persons in first quintile (the poorest) spend Rs 22,653 in consumption as compared to Rs 155,000 of those who fall in the fifth quintile (the richest).',
'content' => '<p>April 10: An average Nepali spends Rs 64,941 in consumption in a year, finds a research by Central Bureau of Statistics (CBS). According to the Household Consumption Survey 2071/72 conducted by CBS during October 2014 to June 2015, the persons in first quintile (the poorest) spend Rs 22,653 in consumption as compared to Rs 155,000 of those who fall in the fifth quintile (the richest).</p>
<p>The survey shows that tenth decile (the richest) spend Rs 215,553 while first decile (the poorest) spend Rs 19,068 in annual consumption. In the FY 2070/71, the annual nominal average consumption expenditure of Nepalis was Rs 62,432. As per the survey, a big gap is seen between consumption of first quintile (the poorest) and fifth quintile (the richest). Similarly, the gap is even wider between consumption of first decile (the poorest) and tenth decile (the richest).</p>
<p>In the FY 2070/71, consumption expenditure of the poorest in first quintile was Rs 22,309 while it was Rs 150,710 for the richest of fifth quintile. Similarly, consumption spending of the richest of the tenth decile was seen at Rs 206,454 while, it was Rs 18,923 for the poorest of first decile.</p>
<p>According to the survey, no significant gap between the poorest of urban areas and rural areas is seen. Nevertheless, there is big gap between urban riches and rural riches. The richest of urban and rural areas spend Rs 173,674 and 124,738 respectively, as per the statistics. “Similarly, urban poorest spend Rs 23,873 while rural poorest spend Rs 22,470 in annual consumption,” says Hem Raj Regmi, Deputy Director General of the Bureau.</p>
<p><strong>More spending on food items</strong></p>
<p>As per the survey, annual consumption of Nepalis stands at Rs 1.622 trillion. The survey also shows that the highest expenditure is done in food items in total consumption.</p>
<p>In total consumption expenditure, the spending of rural areas and urban areas are at Rs 877 billion and Rs 764.24 billion respectively. The total spending of the first decile of the poorest is at Rs 47.75 billion while it is Rs 538 billion for the tenth decile of the richest.</p>
<p>Every Nepali spends a nominal of Rs 33,090 in consumption of items such as food stuffs, meats, egg and milks, ghee, oil, fruits, vegetables and various types of beverages along with tobacco and alcoholic products. Apart from food items, expenditure on other consumable goods is high in urban areas and relatively low in rural areas. “Consumption is less costly in rural areas compared to urban areas as consumers in villages have their own productions besides minimal house rent,” says Regmi. Among such expenditure, per capita spending in urban area is Rs 38,437 and Rs 30,727 in rural area.</p>
<p>In FY 2070/71, per capita spending of Nepalis was recorded at Rs 31,008 in food items. According to the CBS report, a difference of Rs 10,000 exists in the consumption of food stuffs in urban and rural areas. In the urban area, per capita expenditure in food items totals Rs 39,473 while, it is Rs 29,260 in the rural area.</p>
<p>Similarly, In FY 2071/72, per capita spending in healthcare, education, jewelry, social security, insurance, banking services along with administrative costs totaled Rs 24,430. As per the survey, such expenses in urban areas and rural areas are at Rs 38,347 and Rs 18,323 respectively.</p>
<p> </p>
',
'published' => true,
'created' => '2016-04-10',
'modified' => '2016-04-10',
'keywords' => '',
'description' => '',
'sortorder' => '3133',
'image' => '20160410052709_table 2.jpg',
'article_date' => '2016-04-10 00:00:00',
'homepage' => false,
'breaking_news' => false,
'main_news' => true,
'in_scroller' => false,
'user_id' => '16'
),
'ArticleCategory' => array(
'id' => '1',
'name' => 'NEWS',
'parentOf' => '0',
'published' => true,
'registered' => '2015-07-20 00:00:00',
'sortorder' => '158',
'del_flag' => '0',
'homepage' => true,
'display_in_menu' => true,
'user_id' => '1',
'created' => '0000-00-00 00:00:00',
'modified' => '2018-11-22 11:58:49'
),
'User' => array(
'password' => '*****',
'id' => '16',
'user_detail_id' => '0',
'group_id' => '1',
'username' => 'anmaharjan@newbusinessage.com',
'name' => '',
'email' => 'anmaharjan@newbusinessage.com',
'address' => '',
'gender' => '',
'access' => '1',
'phone' => '',
'access_type' => '0',
'activated' => false,
'sortorder' => '0',
'published' => '0',
'created' => '2016-04-04 17:02:17',
'last_login' => '2018-09-17 11:47:56',
'ip' => '202.63.242.112'
),
'ArticleComment' => array(),
'ArticleFeature' => array(),
'ArticleHasAuthor' => array(),
'ArticleHasTag' => array(),
'ArticleView' => array(
(int) 0 => array(
[maximum depth reached]
)
),
'Slider' => array()
),
'current_user' => null,
'logged_in' => false
)
$article = array(
'Article' => array(
'id' => '3295',
'article_category_id' => '1',
'title' => 'Average Nepali Spends Rs 65,000 pa on Consumption',
'sub_title' => '',
'summary' => 'April 10: An average Nepali spends Rs 64,941 in consumption in a year, finds a research by Central Bureau of Statistics (CBS). According to the Household Consumption Survey 2071/72 conducted by CBS during October 2014 to June 2015, the persons in first quintile (the poorest) spend Rs 22,653 in consumption as compared to Rs 155,000 of those who fall in the fifth quintile (the richest).',
'content' => '<p>April 10: An average Nepali spends Rs 64,941 in consumption in a year, finds a research by Central Bureau of Statistics (CBS). According to the Household Consumption Survey 2071/72 conducted by CBS during October 2014 to June 2015, the persons in first quintile (the poorest) spend Rs 22,653 in consumption as compared to Rs 155,000 of those who fall in the fifth quintile (the richest).</p>
<p>The survey shows that tenth decile (the richest) spend Rs 215,553 while first decile (the poorest) spend Rs 19,068 in annual consumption. In the FY 2070/71, the annual nominal average consumption expenditure of Nepalis was Rs 62,432. As per the survey, a big gap is seen between consumption of first quintile (the poorest) and fifth quintile (the richest). Similarly, the gap is even wider between consumption of first decile (the poorest) and tenth decile (the richest).</p>
<p>In the FY 2070/71, consumption expenditure of the poorest in first quintile was Rs 22,309 while it was Rs 150,710 for the richest of fifth quintile. Similarly, consumption spending of the richest of the tenth decile was seen at Rs 206,454 while, it was Rs 18,923 for the poorest of first decile.</p>
<p>According to the survey, no significant gap between the poorest of urban areas and rural areas is seen. Nevertheless, there is big gap between urban riches and rural riches. The richest of urban and rural areas spend Rs 173,674 and 124,738 respectively, as per the statistics. “Similarly, urban poorest spend Rs 23,873 while rural poorest spend Rs 22,470 in annual consumption,” says Hem Raj Regmi, Deputy Director General of the Bureau.</p>
<p><strong>More spending on food items</strong></p>
<p>As per the survey, annual consumption of Nepalis stands at Rs 1.622 trillion. The survey also shows that the highest expenditure is done in food items in total consumption.</p>
<p>In total consumption expenditure, the spending of rural areas and urban areas are at Rs 877 billion and Rs 764.24 billion respectively. The total spending of the first decile of the poorest is at Rs 47.75 billion while it is Rs 538 billion for the tenth decile of the richest.</p>
<p>Every Nepali spends a nominal of Rs 33,090 in consumption of items such as food stuffs, meats, egg and milks, ghee, oil, fruits, vegetables and various types of beverages along with tobacco and alcoholic products. Apart from food items, expenditure on other consumable goods is high in urban areas and relatively low in rural areas. “Consumption is less costly in rural areas compared to urban areas as consumers in villages have their own productions besides minimal house rent,” says Regmi. Among such expenditure, per capita spending in urban area is Rs 38,437 and Rs 30,727 in rural area.</p>
<p>In FY 2070/71, per capita spending of Nepalis was recorded at Rs 31,008 in food items. According to the CBS report, a difference of Rs 10,000 exists in the consumption of food stuffs in urban and rural areas. In the urban area, per capita expenditure in food items totals Rs 39,473 while, it is Rs 29,260 in the rural area.</p>
<p>Similarly, In FY 2071/72, per capita spending in healthcare, education, jewelry, social security, insurance, banking services along with administrative costs totaled Rs 24,430. As per the survey, such expenses in urban areas and rural areas are at Rs 38,347 and Rs 18,323 respectively.</p>
<p> </p>
',
'published' => true,
'created' => '2016-04-10',
'modified' => '2016-04-10',
'keywords' => '',
'description' => '',
'sortorder' => '3133',
'image' => '20160410052709_table 2.jpg',
'article_date' => '2016-04-10 00:00:00',
'homepage' => false,
'breaking_news' => false,
'main_news' => true,
'in_scroller' => false,
'user_id' => '16'
),
'ArticleCategory' => array(
'id' => '1',
'name' => 'NEWS',
'parentOf' => '0',
'published' => true,
'registered' => '2015-07-20 00:00:00',
'sortorder' => '158',
'del_flag' => '0',
'homepage' => true,
'display_in_menu' => true,
'user_id' => '1',
'created' => '0000-00-00 00:00:00',
'modified' => '2018-11-22 11:58:49'
),
'User' => array(
'password' => '*****',
'id' => '16',
'user_detail_id' => '0',
'group_id' => '1',
'username' => 'anmaharjan@newbusinessage.com',
'name' => '',
'email' => 'anmaharjan@newbusinessage.com',
'address' => '',
'gender' => '',
'access' => '1',
'phone' => '',
'access_type' => '0',
'activated' => false,
'sortorder' => '0',
'published' => '0',
'created' => '2016-04-04 17:02:17',
'last_login' => '2018-09-17 11:47:56',
'ip' => '202.63.242.112'
),
'ArticleComment' => array(),
'ArticleFeature' => array(),
'ArticleHasAuthor' => array(),
'ArticleHasTag' => array(),
'ArticleView' => array(
(int) 0 => array(
'article_id' => '3295',
'hit' => '1378'
)
),
'Slider' => array()
)
$current_user = null
$logged_in = false
$xml = false
include - APP/View/Elements/side_bar.ctp, line 133
View::_evaluate() - CORE/Cake/View/View.php, line 971
View::_render() - CORE/Cake/View/View.php, line 933
View::_renderElement() - CORE/Cake/View/View.php, line 1224
View::element() - CORE/Cake/View/View.php, line 418
include - APP/View/Articles/view.ctp, line 391
View::_evaluate() - CORE/Cake/View/View.php, line 971
View::_render() - CORE/Cake/View/View.php, line 933
View::render() - CORE/Cake/View/View.php, line 473
Controller::render() - CORE/Cake/Controller/Controller.php, line 968
Dispatcher::_invoke() - CORE/Cake/Routing/Dispatcher.php, line 200
Dispatcher::dispatch() - CORE/Cake/Routing/Dispatcher.php, line 167
[main] - APP/webroot/index.php, line 117
Warning (2): simplexml_load_file() [<a href='http://php.net/function.simplexml-load-file'>function.simplexml-load-file</a>]: I/O warning : failed to load external entity "" [APP/View/Elements/side_bar.ctp, line 133]
$viewFile = '/var/www/html/newbusinessage.com/app/View/Elements/side_bar.ctp'
$dataForView = array(
'article' => array(
'Article' => array(
'id' => '3295',
'article_category_id' => '1',
'title' => 'Average Nepali Spends Rs 65,000 pa on Consumption',
'sub_title' => '',
'summary' => 'April 10: An average Nepali spends Rs 64,941 in consumption in a year, finds a research by Central Bureau of Statistics (CBS). According to the Household Consumption Survey 2071/72 conducted by CBS during October 2014 to June 2015, the persons in first quintile (the poorest) spend Rs 22,653 in consumption as compared to Rs 155,000 of those who fall in the fifth quintile (the richest).',
'content' => '<p>April 10: An average Nepali spends Rs 64,941 in consumption in a year, finds a research by Central Bureau of Statistics (CBS). According to the Household Consumption Survey 2071/72 conducted by CBS during October 2014 to June 2015, the persons in first quintile (the poorest) spend Rs 22,653 in consumption as compared to Rs 155,000 of those who fall in the fifth quintile (the richest).</p>
<p>The survey shows that tenth decile (the richest) spend Rs 215,553 while first decile (the poorest) spend Rs 19,068 in annual consumption. In the FY 2070/71, the annual nominal average consumption expenditure of Nepalis was Rs 62,432. As per the survey, a big gap is seen between consumption of first quintile (the poorest) and fifth quintile (the richest). Similarly, the gap is even wider between consumption of first decile (the poorest) and tenth decile (the richest).</p>
<p>In the FY 2070/71, consumption expenditure of the poorest in first quintile was Rs 22,309 while it was Rs 150,710 for the richest of fifth quintile. Similarly, consumption spending of the richest of the tenth decile was seen at Rs 206,454 while, it was Rs 18,923 for the poorest of first decile.</p>
<p>According to the survey, no significant gap between the poorest of urban areas and rural areas is seen. Nevertheless, there is big gap between urban riches and rural riches. The richest of urban and rural areas spend Rs 173,674 and 124,738 respectively, as per the statistics. “Similarly, urban poorest spend Rs 23,873 while rural poorest spend Rs 22,470 in annual consumption,” says Hem Raj Regmi, Deputy Director General of the Bureau.</p>
<p><strong>More spending on food items</strong></p>
<p>As per the survey, annual consumption of Nepalis stands at Rs 1.622 trillion. The survey also shows that the highest expenditure is done in food items in total consumption.</p>
<p>In total consumption expenditure, the spending of rural areas and urban areas are at Rs 877 billion and Rs 764.24 billion respectively. The total spending of the first decile of the poorest is at Rs 47.75 billion while it is Rs 538 billion for the tenth decile of the richest.</p>
<p>Every Nepali spends a nominal of Rs 33,090 in consumption of items such as food stuffs, meats, egg and milks, ghee, oil, fruits, vegetables and various types of beverages along with tobacco and alcoholic products. Apart from food items, expenditure on other consumable goods is high in urban areas and relatively low in rural areas. “Consumption is less costly in rural areas compared to urban areas as consumers in villages have their own productions besides minimal house rent,” says Regmi. Among such expenditure, per capita spending in urban area is Rs 38,437 and Rs 30,727 in rural area.</p>
<p>In FY 2070/71, per capita spending of Nepalis was recorded at Rs 31,008 in food items. According to the CBS report, a difference of Rs 10,000 exists in the consumption of food stuffs in urban and rural areas. In the urban area, per capita expenditure in food items totals Rs 39,473 while, it is Rs 29,260 in the rural area.</p>
<p>Similarly, In FY 2071/72, per capita spending in healthcare, education, jewelry, social security, insurance, banking services along with administrative costs totaled Rs 24,430. As per the survey, such expenses in urban areas and rural areas are at Rs 38,347 and Rs 18,323 respectively.</p>
<p> </p>
',
'published' => true,
'created' => '2016-04-10',
'modified' => '2016-04-10',
'keywords' => '',
'description' => '',
'sortorder' => '3133',
'image' => '20160410052709_table 2.jpg',
'article_date' => '2016-04-10 00:00:00',
'homepage' => false,
'breaking_news' => false,
'main_news' => true,
'in_scroller' => false,
'user_id' => '16'
),
'ArticleCategory' => array(
'id' => '1',
'name' => 'NEWS',
'parentOf' => '0',
'published' => true,
'registered' => '2015-07-20 00:00:00',
'sortorder' => '158',
'del_flag' => '0',
'homepage' => true,
'display_in_menu' => true,
'user_id' => '1',
'created' => '0000-00-00 00:00:00',
'modified' => '2018-11-22 11:58:49'
),
'User' => array(
'password' => '*****',
'id' => '16',
'user_detail_id' => '0',
'group_id' => '1',
'username' => 'anmaharjan@newbusinessage.com',
'name' => '',
'email' => 'anmaharjan@newbusinessage.com',
'address' => '',
'gender' => '',
'access' => '1',
'phone' => '',
'access_type' => '0',
'activated' => false,
'sortorder' => '0',
'published' => '0',
'created' => '2016-04-04 17:02:17',
'last_login' => '2018-09-17 11:47:56',
'ip' => '202.63.242.112'
),
'ArticleComment' => array(),
'ArticleFeature' => array(),
'ArticleHasAuthor' => array(),
'ArticleHasTag' => array(),
'ArticleView' => array(
(int) 0 => array(
[maximum depth reached]
)
),
'Slider' => array()
),
'current_user' => null,
'logged_in' => false
)
$article = array(
'Article' => array(
'id' => '3295',
'article_category_id' => '1',
'title' => 'Average Nepali Spends Rs 65,000 pa on Consumption',
'sub_title' => '',
'summary' => 'April 10: An average Nepali spends Rs 64,941 in consumption in a year, finds a research by Central Bureau of Statistics (CBS). According to the Household Consumption Survey 2071/72 conducted by CBS during October 2014 to June 2015, the persons in first quintile (the poorest) spend Rs 22,653 in consumption as compared to Rs 155,000 of those who fall in the fifth quintile (the richest).',
'content' => '<p>April 10: An average Nepali spends Rs 64,941 in consumption in a year, finds a research by Central Bureau of Statistics (CBS). According to the Household Consumption Survey 2071/72 conducted by CBS during October 2014 to June 2015, the persons in first quintile (the poorest) spend Rs 22,653 in consumption as compared to Rs 155,000 of those who fall in the fifth quintile (the richest).</p>
<p>The survey shows that tenth decile (the richest) spend Rs 215,553 while first decile (the poorest) spend Rs 19,068 in annual consumption. In the FY 2070/71, the annual nominal average consumption expenditure of Nepalis was Rs 62,432. As per the survey, a big gap is seen between consumption of first quintile (the poorest) and fifth quintile (the richest). Similarly, the gap is even wider between consumption of first decile (the poorest) and tenth decile (the richest).</p>
<p>In the FY 2070/71, consumption expenditure of the poorest in first quintile was Rs 22,309 while it was Rs 150,710 for the richest of fifth quintile. Similarly, consumption spending of the richest of the tenth decile was seen at Rs 206,454 while, it was Rs 18,923 for the poorest of first decile.</p>
<p>According to the survey, no significant gap between the poorest of urban areas and rural areas is seen. Nevertheless, there is big gap between urban riches and rural riches. The richest of urban and rural areas spend Rs 173,674 and 124,738 respectively, as per the statistics. “Similarly, urban poorest spend Rs 23,873 while rural poorest spend Rs 22,470 in annual consumption,” says Hem Raj Regmi, Deputy Director General of the Bureau.</p>
<p><strong>More spending on food items</strong></p>
<p>As per the survey, annual consumption of Nepalis stands at Rs 1.622 trillion. The survey also shows that the highest expenditure is done in food items in total consumption.</p>
<p>In total consumption expenditure, the spending of rural areas and urban areas are at Rs 877 billion and Rs 764.24 billion respectively. The total spending of the first decile of the poorest is at Rs 47.75 billion while it is Rs 538 billion for the tenth decile of the richest.</p>
<p>Every Nepali spends a nominal of Rs 33,090 in consumption of items such as food stuffs, meats, egg and milks, ghee, oil, fruits, vegetables and various types of beverages along with tobacco and alcoholic products. Apart from food items, expenditure on other consumable goods is high in urban areas and relatively low in rural areas. “Consumption is less costly in rural areas compared to urban areas as consumers in villages have their own productions besides minimal house rent,” says Regmi. Among such expenditure, per capita spending in urban area is Rs 38,437 and Rs 30,727 in rural area.</p>
<p>In FY 2070/71, per capita spending of Nepalis was recorded at Rs 31,008 in food items. According to the CBS report, a difference of Rs 10,000 exists in the consumption of food stuffs in urban and rural areas. In the urban area, per capita expenditure in food items totals Rs 39,473 while, it is Rs 29,260 in the rural area.</p>
<p>Similarly, In FY 2071/72, per capita spending in healthcare, education, jewelry, social security, insurance, banking services along with administrative costs totaled Rs 24,430. As per the survey, such expenses in urban areas and rural areas are at Rs 38,347 and Rs 18,323 respectively.</p>
<p> </p>
',
'published' => true,
'created' => '2016-04-10',
'modified' => '2016-04-10',
'keywords' => '',
'description' => '',
'sortorder' => '3133',
'image' => '20160410052709_table 2.jpg',
'article_date' => '2016-04-10 00:00:00',
'homepage' => false,
'breaking_news' => false,
'main_news' => true,
'in_scroller' => false,
'user_id' => '16'
),
'ArticleCategory' => array(
'id' => '1',
'name' => 'NEWS',
'parentOf' => '0',
'published' => true,
'registered' => '2015-07-20 00:00:00',
'sortorder' => '158',
'del_flag' => '0',
'homepage' => true,
'display_in_menu' => true,
'user_id' => '1',
'created' => '0000-00-00 00:00:00',
'modified' => '2018-11-22 11:58:49'
),
'User' => array(
'password' => '*****',
'id' => '16',
'user_detail_id' => '0',
'group_id' => '1',
'username' => 'anmaharjan@newbusinessage.com',
'name' => '',
'email' => 'anmaharjan@newbusinessage.com',
'address' => '',
'gender' => '',
'access' => '1',
'phone' => '',
'access_type' => '0',
'activated' => false,
'sortorder' => '0',
'published' => '0',
'created' => '2016-04-04 17:02:17',
'last_login' => '2018-09-17 11:47:56',
'ip' => '202.63.242.112'
),
'ArticleComment' => array(),
'ArticleFeature' => array(),
'ArticleHasAuthor' => array(),
'ArticleHasTag' => array(),
'ArticleView' => array(
(int) 0 => array(
'article_id' => '3295',
'hit' => '1378'
)
),
'Slider' => array()
)
$current_user = null
$logged_in = false
$xml = false
simplexml_load_file - [internal], line ??
include - APP/View/Elements/side_bar.ctp, line 133
View::_evaluate() - CORE/Cake/View/View.php, line 971
View::_render() - CORE/Cake/View/View.php, line 933
View::_renderElement() - CORE/Cake/View/View.php, line 1224
View::element() - CORE/Cake/View/View.php, line 418
include - APP/View/Articles/view.ctp, line 391
View::_evaluate() - CORE/Cake/View/View.php, line 971
View::_render() - CORE/Cake/View/View.php, line 933
View::render() - CORE/Cake/View/View.php, line 473
Controller::render() - CORE/Cake/Controller/Controller.php, line 968
Dispatcher::_invoke() - CORE/Cake/Routing/Dispatcher.php, line 200
Dispatcher::dispatch() - CORE/Cake/Routing/Dispatcher.php, line 167
[main] - APP/webroot/index.php, line 117