$user = $this->Session->read('Auth.User');
//find the group of logged user
$groupId = $user['Group']['id'];
$viewFile = '/var/www/html/newbusinessage.com/app/View/Articles/view.ctp'
$dataForView = array(
'article' => array(
'Article' => array(
'id' => '14745',
'article_category_id' => '1',
'title' => 'Trade Deficit Increases to Rs 880 Billion',
'sub_title' => '',
'summary' => 'February 10: Nepal’s trade deficit increased by 46.6 percent in the first six months of the current fiscal year to Rs 880.49 billion.',
'content' => '<p><span style="font-size:11pt"><span style="font-family:Calibri,"sans-serif""><span style="font-size:14.0pt">February 10: Nepal’s trade deficit increased by 46.6 percent in the first six months of the current fiscal year to Rs 880.49 billion. According to the Nepal Rastra Bank, the total trade deficit had contracted 5.8 percent in the corresponding period of the previous year. </span></span></span></p>
<p><span style="font-size:11pt"><span style="font-family:Calibri,"sans-serif""><span style="font-size:14.0pt">The Current Macroeconomic and Financial Situation Report unveiled by the central bank on Wednesday states that the export-import ratio increased to 11.9 percent in the review period from 9.2 percent in the corresponding period of the previous year. </span></span></span></p>
<p><span style="font-size:11pt"><span style="font-family:Calibri,"sans-serif""><span style="font-size:14.0pt">During the six months of FY 2021/22, merchandise exports increased 95.5 percent to Rs 118.85 billion compared to an increase of 6.1 percent in the same period of the previous year. </span></span></span></p>
<p><span style="font-size:11pt"><span style="font-family:Calibri,"sans-serif""><span style="font-size:14.0pt">Destination-wise, exports to India and other countries increased 121.8 percent and 30.2 respectively whereas exports to China decreased 10.2 percent. </span></span></span></p>
<p><span style="font-size:11pt"><span style="font-family:Calibri,"sans-serif""><span style="font-size:14.0pt">Exports of palm oil, soybean oil, oil cakes, juice, woolen carpets, among others, increased whereas exports of cardamom, tea, herbs, zinc sheet, wire, among others, decreased in the review period, the report states.</span></span></span></p>
<p><span style="font-size:11pt"><span style="font-family:Calibri,"sans-serif""><span style="font-size:14.0pt">Similarly, merchandise imports during the six months of FY 2021/22 increased 51.1 percent to Rs 999.34 billion against a decrease of 4.8 percent a year ago. Destination-wise, imports from India, China and other countries increased 37.5 percent, 51.5 percent, and 98.2 percent respectively. </span></span></span></p>
<p><span style="font-size:11pt"><span style="font-family:Calibri,"sans-serif""><span style="font-size:14.0pt">According to the NRB report, imports of petroleum products, medicine, crude palm oil, transport equipment, vehicle and other parts, crude soybean oil, among others, increased whereas imports of MS billet, cement, pulses, molasses sugar, insecticides, among others, decreased in the review period. </span></span></span></p>
<p><span style="font-size:11pt"><span style="font-family:Calibri,"sans-serif""><span style="font-size:14.0pt">Based on customs points, exports from Kanchanpur, Mechi, and Nepalgunj customs offices decreased whereas exports from all the other major customs points increased in the review period. On the import side, imports from all the major customs points increased in the review period. </span></span></span></p>
<p> </p>
<p> </p>
<p><span style="font-size:11pt"><span style="font-family:Calibri,"sans-serif""><span style="font-size:14.0pt">During the six months of FY 2021/22, merchandise imports from India by paying convertible foreign currency amounted Rs 110.91 billion. Such amount was Rs 83.01 billion in the same period of the previous year. </span></span></span></p>
<p><span style="font-size:11pt"><span style="font-family:Calibri,"sans-serif""><span style="font-size:14.0pt">As per the Broad Economic Categories (BEC), the intermediate and final consumption goods accounted for 47.8 percent and 52.2 percent of the total exports respectively, whereas the ratio of capital goods in total exports remained negligible at 0.02 percent in the review period.</span></span></span></p>
<p><span style="font-size:11pt"><span style="font-family:Calibri,"sans-serif""><span style="font-size:14.0pt">In the same period of the previous year, the ratio of intermediate, capital and final consumption goods remained 31.9 percent, 0.6 percent and 67.5 percent of total exports respectively. </span></span></span></p>
<p><span style="font-size:11pt"><span style="font-family:Calibri,"sans-serif""><span style="font-size:14.0pt">On the imports side, the share of intermediate goods remained 53.7 percent, capital goods 10.9 percent and final consumption goods 35.4 percent in the review period. Such ratios were 52.6 percent, 12.0 percent and 35.4 percent respectively in the same period of the previous year, the report stated.</span></span></span></p>
',
'published' => true,
'created' => '2022-02-10',
'modified' => '2022-02-10',
'keywords' => '',
'description' => '',
'sortorder' => '14488',
'image' => '20220210025613_Trade.jpg',
'article_date' => '2022-02-10 14:55:28',
'homepage' => false,
'breaking_news' => false,
'main_news' => true,
'in_scroller' => null,
'user_id' => '34'
),
'ArticleCategory' => array(
'id' => '1',
'name' => 'NEWS',
'parentOf' => '0',
'published' => true,
'registered' => '2015-07-20 00:00:00',
'sortorder' => '158',
'del_flag' => '0',
'homepage' => true,
'display_in_menu' => true,
'user_id' => '1',
'created' => '0000-00-00 00:00:00',
'modified' => '2018-11-22 11:58:49'
),
'User' => array(
'password' => '*****',
'id' => '34',
'user_detail_id' => '1',
'group_id' => '1',
'username' => 'neeraj.roy@newbusinessage.com',
'name' => null,
'email' => 'neeraj.roy@newbusinessage.com',
'address' => null,
'gender' => null,
'access' => '1',
'phone' => null,
'access_type' => null,
'activated' => true,
'sortorder' => null,
'published' => null,
'created' => '2020-07-19 16:40:23',
'last_login' => '2024-08-13 13:55:06',
'ip' => '172.69.41.137'
),
'ArticleComment' => array(),
'ArticleFeature' => array(),
'ArticleHasAuthor' => array(),
'ArticleHasTag' => array(),
'ArticleView' => array(
(int) 0 => array(
[maximum depth reached]
)
),
'Slider' => array()
),
'current_user' => null,
'logged_in' => false
)
$article = array(
'Article' => array(
'id' => '14745',
'article_category_id' => '1',
'title' => 'Trade Deficit Increases to Rs 880 Billion',
'sub_title' => '',
'summary' => 'February 10: Nepal’s trade deficit increased by 46.6 percent in the first six months of the current fiscal year to Rs 880.49 billion.',
'content' => '<p><span style="font-size:11pt"><span style="font-family:Calibri,"sans-serif""><span style="font-size:14.0pt">February 10: Nepal’s trade deficit increased by 46.6 percent in the first six months of the current fiscal year to Rs 880.49 billion. According to the Nepal Rastra Bank, the total trade deficit had contracted 5.8 percent in the corresponding period of the previous year. </span></span></span></p>
<p><span style="font-size:11pt"><span style="font-family:Calibri,"sans-serif""><span style="font-size:14.0pt">The Current Macroeconomic and Financial Situation Report unveiled by the central bank on Wednesday states that the export-import ratio increased to 11.9 percent in the review period from 9.2 percent in the corresponding period of the previous year. </span></span></span></p>
<p><span style="font-size:11pt"><span style="font-family:Calibri,"sans-serif""><span style="font-size:14.0pt">During the six months of FY 2021/22, merchandise exports increased 95.5 percent to Rs 118.85 billion compared to an increase of 6.1 percent in the same period of the previous year. </span></span></span></p>
<p><span style="font-size:11pt"><span style="font-family:Calibri,"sans-serif""><span style="font-size:14.0pt">Destination-wise, exports to India and other countries increased 121.8 percent and 30.2 respectively whereas exports to China decreased 10.2 percent. </span></span></span></p>
<p><span style="font-size:11pt"><span style="font-family:Calibri,"sans-serif""><span style="font-size:14.0pt">Exports of palm oil, soybean oil, oil cakes, juice, woolen carpets, among others, increased whereas exports of cardamom, tea, herbs, zinc sheet, wire, among others, decreased in the review period, the report states.</span></span></span></p>
<p><span style="font-size:11pt"><span style="font-family:Calibri,"sans-serif""><span style="font-size:14.0pt">Similarly, merchandise imports during the six months of FY 2021/22 increased 51.1 percent to Rs 999.34 billion against a decrease of 4.8 percent a year ago. Destination-wise, imports from India, China and other countries increased 37.5 percent, 51.5 percent, and 98.2 percent respectively. </span></span></span></p>
<p><span style="font-size:11pt"><span style="font-family:Calibri,"sans-serif""><span style="font-size:14.0pt">According to the NRB report, imports of petroleum products, medicine, crude palm oil, transport equipment, vehicle and other parts, crude soybean oil, among others, increased whereas imports of MS billet, cement, pulses, molasses sugar, insecticides, among others, decreased in the review period. </span></span></span></p>
<p><span style="font-size:11pt"><span style="font-family:Calibri,"sans-serif""><span style="font-size:14.0pt">Based on customs points, exports from Kanchanpur, Mechi, and Nepalgunj customs offices decreased whereas exports from all the other major customs points increased in the review period. On the import side, imports from all the major customs points increased in the review period. </span></span></span></p>
<p> </p>
<p> </p>
<p><span style="font-size:11pt"><span style="font-family:Calibri,"sans-serif""><span style="font-size:14.0pt">During the six months of FY 2021/22, merchandise imports from India by paying convertible foreign currency amounted Rs 110.91 billion. Such amount was Rs 83.01 billion in the same period of the previous year. </span></span></span></p>
<p><span style="font-size:11pt"><span style="font-family:Calibri,"sans-serif""><span style="font-size:14.0pt">As per the Broad Economic Categories (BEC), the intermediate and final consumption goods accounted for 47.8 percent and 52.2 percent of the total exports respectively, whereas the ratio of capital goods in total exports remained negligible at 0.02 percent in the review period.</span></span></span></p>
<p><span style="font-size:11pt"><span style="font-family:Calibri,"sans-serif""><span style="font-size:14.0pt">In the same period of the previous year, the ratio of intermediate, capital and final consumption goods remained 31.9 percent, 0.6 percent and 67.5 percent of total exports respectively. </span></span></span></p>
<p><span style="font-size:11pt"><span style="font-family:Calibri,"sans-serif""><span style="font-size:14.0pt">On the imports side, the share of intermediate goods remained 53.7 percent, capital goods 10.9 percent and final consumption goods 35.4 percent in the review period. Such ratios were 52.6 percent, 12.0 percent and 35.4 percent respectively in the same period of the previous year, the report stated.</span></span></span></p>
',
'published' => true,
'created' => '2022-02-10',
'modified' => '2022-02-10',
'keywords' => '',
'description' => '',
'sortorder' => '14488',
'image' => '20220210025613_Trade.jpg',
'article_date' => '2022-02-10 14:55:28',
'homepage' => false,
'breaking_news' => false,
'main_news' => true,
'in_scroller' => null,
'user_id' => '34'
),
'ArticleCategory' => array(
'id' => '1',
'name' => 'NEWS',
'parentOf' => '0',
'published' => true,
'registered' => '2015-07-20 00:00:00',
'sortorder' => '158',
'del_flag' => '0',
'homepage' => true,
'display_in_menu' => true,
'user_id' => '1',
'created' => '0000-00-00 00:00:00',
'modified' => '2018-11-22 11:58:49'
),
'User' => array(
'password' => '*****',
'id' => '34',
'user_detail_id' => '1',
'group_id' => '1',
'username' => 'neeraj.roy@newbusinessage.com',
'name' => null,
'email' => 'neeraj.roy@newbusinessage.com',
'address' => null,
'gender' => null,
'access' => '1',
'phone' => null,
'access_type' => null,
'activated' => true,
'sortorder' => null,
'published' => null,
'created' => '2020-07-19 16:40:23',
'last_login' => '2024-08-13 13:55:06',
'ip' => '172.69.41.137'
),
'ArticleComment' => array(),
'ArticleFeature' => array(),
'ArticleHasAuthor' => array(),
'ArticleHasTag' => array(),
'ArticleView' => array(
(int) 0 => array(
'article_id' => '14745',
'hit' => '932'
)
),
'Slider' => array()
)
$current_user = null
$logged_in = false
$image = 'https://www.old.newbusinessage.com/app/webroot/img/news/20220210025613_Trade.jpg'
$user = null
include - APP/View/Articles/view.ctp, line 115
View::_evaluate() - CORE/Cake/View/View.php, line 971
View::_render() - CORE/Cake/View/View.php, line 933
View::render() - CORE/Cake/View/View.php, line 473
Controller::render() - CORE/Cake/Controller/Controller.php, line 968
Dispatcher::_invoke() - CORE/Cake/Routing/Dispatcher.php, line 200
Dispatcher::dispatch() - CORE/Cake/Routing/Dispatcher.php, line 167
[main] - APP/webroot/index.php, line 117
Notice (8): Trying to access array offset on value of type null [APP/View/Articles/view.ctp, line 115]
$user = $this->Session->read('Auth.User');
//find the group of logged user
$groupId = $user['Group']['id'];
$viewFile = '/var/www/html/newbusinessage.com/app/View/Articles/view.ctp'
$dataForView = array(
'article' => array(
'Article' => array(
'id' => '14745',
'article_category_id' => '1',
'title' => 'Trade Deficit Increases to Rs 880 Billion',
'sub_title' => '',
'summary' => 'February 10: Nepal’s trade deficit increased by 46.6 percent in the first six months of the current fiscal year to Rs 880.49 billion.',
'content' => '<p><span style="font-size:11pt"><span style="font-family:Calibri,"sans-serif""><span style="font-size:14.0pt">February 10: Nepal’s trade deficit increased by 46.6 percent in the first six months of the current fiscal year to Rs 880.49 billion. According to the Nepal Rastra Bank, the total trade deficit had contracted 5.8 percent in the corresponding period of the previous year. </span></span></span></p>
<p><span style="font-size:11pt"><span style="font-family:Calibri,"sans-serif""><span style="font-size:14.0pt">The Current Macroeconomic and Financial Situation Report unveiled by the central bank on Wednesday states that the export-import ratio increased to 11.9 percent in the review period from 9.2 percent in the corresponding period of the previous year. </span></span></span></p>
<p><span style="font-size:11pt"><span style="font-family:Calibri,"sans-serif""><span style="font-size:14.0pt">During the six months of FY 2021/22, merchandise exports increased 95.5 percent to Rs 118.85 billion compared to an increase of 6.1 percent in the same period of the previous year. </span></span></span></p>
<p><span style="font-size:11pt"><span style="font-family:Calibri,"sans-serif""><span style="font-size:14.0pt">Destination-wise, exports to India and other countries increased 121.8 percent and 30.2 respectively whereas exports to China decreased 10.2 percent. </span></span></span></p>
<p><span style="font-size:11pt"><span style="font-family:Calibri,"sans-serif""><span style="font-size:14.0pt">Exports of palm oil, soybean oil, oil cakes, juice, woolen carpets, among others, increased whereas exports of cardamom, tea, herbs, zinc sheet, wire, among others, decreased in the review period, the report states.</span></span></span></p>
<p><span style="font-size:11pt"><span style="font-family:Calibri,"sans-serif""><span style="font-size:14.0pt">Similarly, merchandise imports during the six months of FY 2021/22 increased 51.1 percent to Rs 999.34 billion against a decrease of 4.8 percent a year ago. Destination-wise, imports from India, China and other countries increased 37.5 percent, 51.5 percent, and 98.2 percent respectively. </span></span></span></p>
<p><span style="font-size:11pt"><span style="font-family:Calibri,"sans-serif""><span style="font-size:14.0pt">According to the NRB report, imports of petroleum products, medicine, crude palm oil, transport equipment, vehicle and other parts, crude soybean oil, among others, increased whereas imports of MS billet, cement, pulses, molasses sugar, insecticides, among others, decreased in the review period. </span></span></span></p>
<p><span style="font-size:11pt"><span style="font-family:Calibri,"sans-serif""><span style="font-size:14.0pt">Based on customs points, exports from Kanchanpur, Mechi, and Nepalgunj customs offices decreased whereas exports from all the other major customs points increased in the review period. On the import side, imports from all the major customs points increased in the review period. </span></span></span></p>
<p> </p>
<p> </p>
<p><span style="font-size:11pt"><span style="font-family:Calibri,"sans-serif""><span style="font-size:14.0pt">During the six months of FY 2021/22, merchandise imports from India by paying convertible foreign currency amounted Rs 110.91 billion. Such amount was Rs 83.01 billion in the same period of the previous year. </span></span></span></p>
<p><span style="font-size:11pt"><span style="font-family:Calibri,"sans-serif""><span style="font-size:14.0pt">As per the Broad Economic Categories (BEC), the intermediate and final consumption goods accounted for 47.8 percent and 52.2 percent of the total exports respectively, whereas the ratio of capital goods in total exports remained negligible at 0.02 percent in the review period.</span></span></span></p>
<p><span style="font-size:11pt"><span style="font-family:Calibri,"sans-serif""><span style="font-size:14.0pt">In the same period of the previous year, the ratio of intermediate, capital and final consumption goods remained 31.9 percent, 0.6 percent and 67.5 percent of total exports respectively. </span></span></span></p>
<p><span style="font-size:11pt"><span style="font-family:Calibri,"sans-serif""><span style="font-size:14.0pt">On the imports side, the share of intermediate goods remained 53.7 percent, capital goods 10.9 percent and final consumption goods 35.4 percent in the review period. Such ratios were 52.6 percent, 12.0 percent and 35.4 percent respectively in the same period of the previous year, the report stated.</span></span></span></p>
',
'published' => true,
'created' => '2022-02-10',
'modified' => '2022-02-10',
'keywords' => '',
'description' => '',
'sortorder' => '14488',
'image' => '20220210025613_Trade.jpg',
'article_date' => '2022-02-10 14:55:28',
'homepage' => false,
'breaking_news' => false,
'main_news' => true,
'in_scroller' => null,
'user_id' => '34'
),
'ArticleCategory' => array(
'id' => '1',
'name' => 'NEWS',
'parentOf' => '0',
'published' => true,
'registered' => '2015-07-20 00:00:00',
'sortorder' => '158',
'del_flag' => '0',
'homepage' => true,
'display_in_menu' => true,
'user_id' => '1',
'created' => '0000-00-00 00:00:00',
'modified' => '2018-11-22 11:58:49'
),
'User' => array(
'password' => '*****',
'id' => '34',
'user_detail_id' => '1',
'group_id' => '1',
'username' => 'neeraj.roy@newbusinessage.com',
'name' => null,
'email' => 'neeraj.roy@newbusinessage.com',
'address' => null,
'gender' => null,
'access' => '1',
'phone' => null,
'access_type' => null,
'activated' => true,
'sortorder' => null,
'published' => null,
'created' => '2020-07-19 16:40:23',
'last_login' => '2024-08-13 13:55:06',
'ip' => '172.69.41.137'
),
'ArticleComment' => array(),
'ArticleFeature' => array(),
'ArticleHasAuthor' => array(),
'ArticleHasTag' => array(),
'ArticleView' => array(
(int) 0 => array(
[maximum depth reached]
)
),
'Slider' => array()
),
'current_user' => null,
'logged_in' => false
)
$article = array(
'Article' => array(
'id' => '14745',
'article_category_id' => '1',
'title' => 'Trade Deficit Increases to Rs 880 Billion',
'sub_title' => '',
'summary' => 'February 10: Nepal’s trade deficit increased by 46.6 percent in the first six months of the current fiscal year to Rs 880.49 billion.',
'content' => '<p><span style="font-size:11pt"><span style="font-family:Calibri,"sans-serif""><span style="font-size:14.0pt">February 10: Nepal’s trade deficit increased by 46.6 percent in the first six months of the current fiscal year to Rs 880.49 billion. According to the Nepal Rastra Bank, the total trade deficit had contracted 5.8 percent in the corresponding period of the previous year. </span></span></span></p>
<p><span style="font-size:11pt"><span style="font-family:Calibri,"sans-serif""><span style="font-size:14.0pt">The Current Macroeconomic and Financial Situation Report unveiled by the central bank on Wednesday states that the export-import ratio increased to 11.9 percent in the review period from 9.2 percent in the corresponding period of the previous year. </span></span></span></p>
<p><span style="font-size:11pt"><span style="font-family:Calibri,"sans-serif""><span style="font-size:14.0pt">During the six months of FY 2021/22, merchandise exports increased 95.5 percent to Rs 118.85 billion compared to an increase of 6.1 percent in the same period of the previous year. </span></span></span></p>
<p><span style="font-size:11pt"><span style="font-family:Calibri,"sans-serif""><span style="font-size:14.0pt">Destination-wise, exports to India and other countries increased 121.8 percent and 30.2 respectively whereas exports to China decreased 10.2 percent. </span></span></span></p>
<p><span style="font-size:11pt"><span style="font-family:Calibri,"sans-serif""><span style="font-size:14.0pt">Exports of palm oil, soybean oil, oil cakes, juice, woolen carpets, among others, increased whereas exports of cardamom, tea, herbs, zinc sheet, wire, among others, decreased in the review period, the report states.</span></span></span></p>
<p><span style="font-size:11pt"><span style="font-family:Calibri,"sans-serif""><span style="font-size:14.0pt">Similarly, merchandise imports during the six months of FY 2021/22 increased 51.1 percent to Rs 999.34 billion against a decrease of 4.8 percent a year ago. Destination-wise, imports from India, China and other countries increased 37.5 percent, 51.5 percent, and 98.2 percent respectively. </span></span></span></p>
<p><span style="font-size:11pt"><span style="font-family:Calibri,"sans-serif""><span style="font-size:14.0pt">According to the NRB report, imports of petroleum products, medicine, crude palm oil, transport equipment, vehicle and other parts, crude soybean oil, among others, increased whereas imports of MS billet, cement, pulses, molasses sugar, insecticides, among others, decreased in the review period. </span></span></span></p>
<p><span style="font-size:11pt"><span style="font-family:Calibri,"sans-serif""><span style="font-size:14.0pt">Based on customs points, exports from Kanchanpur, Mechi, and Nepalgunj customs offices decreased whereas exports from all the other major customs points increased in the review period. On the import side, imports from all the major customs points increased in the review period. </span></span></span></p>
<p> </p>
<p> </p>
<p><span style="font-size:11pt"><span style="font-family:Calibri,"sans-serif""><span style="font-size:14.0pt">During the six months of FY 2021/22, merchandise imports from India by paying convertible foreign currency amounted Rs 110.91 billion. Such amount was Rs 83.01 billion in the same period of the previous year. </span></span></span></p>
<p><span style="font-size:11pt"><span style="font-family:Calibri,"sans-serif""><span style="font-size:14.0pt">As per the Broad Economic Categories (BEC), the intermediate and final consumption goods accounted for 47.8 percent and 52.2 percent of the total exports respectively, whereas the ratio of capital goods in total exports remained negligible at 0.02 percent in the review period.</span></span></span></p>
<p><span style="font-size:11pt"><span style="font-family:Calibri,"sans-serif""><span style="font-size:14.0pt">In the same period of the previous year, the ratio of intermediate, capital and final consumption goods remained 31.9 percent, 0.6 percent and 67.5 percent of total exports respectively. </span></span></span></p>
<p><span style="font-size:11pt"><span style="font-family:Calibri,"sans-serif""><span style="font-size:14.0pt">On the imports side, the share of intermediate goods remained 53.7 percent, capital goods 10.9 percent and final consumption goods 35.4 percent in the review period. Such ratios were 52.6 percent, 12.0 percent and 35.4 percent respectively in the same period of the previous year, the report stated.</span></span></span></p>
',
'published' => true,
'created' => '2022-02-10',
'modified' => '2022-02-10',
'keywords' => '',
'description' => '',
'sortorder' => '14488',
'image' => '20220210025613_Trade.jpg',
'article_date' => '2022-02-10 14:55:28',
'homepage' => false,
'breaking_news' => false,
'main_news' => true,
'in_scroller' => null,
'user_id' => '34'
),
'ArticleCategory' => array(
'id' => '1',
'name' => 'NEWS',
'parentOf' => '0',
'published' => true,
'registered' => '2015-07-20 00:00:00',
'sortorder' => '158',
'del_flag' => '0',
'homepage' => true,
'display_in_menu' => true,
'user_id' => '1',
'created' => '0000-00-00 00:00:00',
'modified' => '2018-11-22 11:58:49'
),
'User' => array(
'password' => '*****',
'id' => '34',
'user_detail_id' => '1',
'group_id' => '1',
'username' => 'neeraj.roy@newbusinessage.com',
'name' => null,
'email' => 'neeraj.roy@newbusinessage.com',
'address' => null,
'gender' => null,
'access' => '1',
'phone' => null,
'access_type' => null,
'activated' => true,
'sortorder' => null,
'published' => null,
'created' => '2020-07-19 16:40:23',
'last_login' => '2024-08-13 13:55:06',
'ip' => '172.69.41.137'
),
'ArticleComment' => array(),
'ArticleFeature' => array(),
'ArticleHasAuthor' => array(),
'ArticleHasTag' => array(),
'ArticleView' => array(
(int) 0 => array(
'article_id' => '14745',
'hit' => '932'
)
),
'Slider' => array()
)
$current_user = null
$logged_in = false
$image = 'https://www.old.newbusinessage.com/app/webroot/img/news/20220210025613_Trade.jpg'
$user = null
include - APP/View/Articles/view.ctp, line 115
View::_evaluate() - CORE/Cake/View/View.php, line 971
View::_render() - CORE/Cake/View/View.php, line 933
View::render() - CORE/Cake/View/View.php, line 473
Controller::render() - CORE/Cake/Controller/Controller.php, line 968
Dispatcher::_invoke() - CORE/Cake/Routing/Dispatcher.php, line 200
Dispatcher::dispatch() - CORE/Cake/Routing/Dispatcher.php, line 167
[main] - APP/webroot/index.php, line 117
Notice (8): Trying to access array offset on value of type null [APP/View/Articles/view.ctp, line 116]
//find the group of logged user
$groupId = $user['Group']['id'];
$user_id=$user["id"];
$viewFile = '/var/www/html/newbusinessage.com/app/View/Articles/view.ctp'
$dataForView = array(
'article' => array(
'Article' => array(
'id' => '14745',
'article_category_id' => '1',
'title' => 'Trade Deficit Increases to Rs 880 Billion',
'sub_title' => '',
'summary' => 'February 10: Nepal’s trade deficit increased by 46.6 percent in the first six months of the current fiscal year to Rs 880.49 billion.',
'content' => '<p><span style="font-size:11pt"><span style="font-family:Calibri,"sans-serif""><span style="font-size:14.0pt">February 10: Nepal’s trade deficit increased by 46.6 percent in the first six months of the current fiscal year to Rs 880.49 billion. According to the Nepal Rastra Bank, the total trade deficit had contracted 5.8 percent in the corresponding period of the previous year. </span></span></span></p>
<p><span style="font-size:11pt"><span style="font-family:Calibri,"sans-serif""><span style="font-size:14.0pt">The Current Macroeconomic and Financial Situation Report unveiled by the central bank on Wednesday states that the export-import ratio increased to 11.9 percent in the review period from 9.2 percent in the corresponding period of the previous year. </span></span></span></p>
<p><span style="font-size:11pt"><span style="font-family:Calibri,"sans-serif""><span style="font-size:14.0pt">During the six months of FY 2021/22, merchandise exports increased 95.5 percent to Rs 118.85 billion compared to an increase of 6.1 percent in the same period of the previous year. </span></span></span></p>
<p><span style="font-size:11pt"><span style="font-family:Calibri,"sans-serif""><span style="font-size:14.0pt">Destination-wise, exports to India and other countries increased 121.8 percent and 30.2 respectively whereas exports to China decreased 10.2 percent. </span></span></span></p>
<p><span style="font-size:11pt"><span style="font-family:Calibri,"sans-serif""><span style="font-size:14.0pt">Exports of palm oil, soybean oil, oil cakes, juice, woolen carpets, among others, increased whereas exports of cardamom, tea, herbs, zinc sheet, wire, among others, decreased in the review period, the report states.</span></span></span></p>
<p><span style="font-size:11pt"><span style="font-family:Calibri,"sans-serif""><span style="font-size:14.0pt">Similarly, merchandise imports during the six months of FY 2021/22 increased 51.1 percent to Rs 999.34 billion against a decrease of 4.8 percent a year ago. Destination-wise, imports from India, China and other countries increased 37.5 percent, 51.5 percent, and 98.2 percent respectively. </span></span></span></p>
<p><span style="font-size:11pt"><span style="font-family:Calibri,"sans-serif""><span style="font-size:14.0pt">According to the NRB report, imports of petroleum products, medicine, crude palm oil, transport equipment, vehicle and other parts, crude soybean oil, among others, increased whereas imports of MS billet, cement, pulses, molasses sugar, insecticides, among others, decreased in the review period. </span></span></span></p>
<p><span style="font-size:11pt"><span style="font-family:Calibri,"sans-serif""><span style="font-size:14.0pt">Based on customs points, exports from Kanchanpur, Mechi, and Nepalgunj customs offices decreased whereas exports from all the other major customs points increased in the review period. On the import side, imports from all the major customs points increased in the review period. </span></span></span></p>
<p> </p>
<p> </p>
<p><span style="font-size:11pt"><span style="font-family:Calibri,"sans-serif""><span style="font-size:14.0pt">During the six months of FY 2021/22, merchandise imports from India by paying convertible foreign currency amounted Rs 110.91 billion. Such amount was Rs 83.01 billion in the same period of the previous year. </span></span></span></p>
<p><span style="font-size:11pt"><span style="font-family:Calibri,"sans-serif""><span style="font-size:14.0pt">As per the Broad Economic Categories (BEC), the intermediate and final consumption goods accounted for 47.8 percent and 52.2 percent of the total exports respectively, whereas the ratio of capital goods in total exports remained negligible at 0.02 percent in the review period.</span></span></span></p>
<p><span style="font-size:11pt"><span style="font-family:Calibri,"sans-serif""><span style="font-size:14.0pt">In the same period of the previous year, the ratio of intermediate, capital and final consumption goods remained 31.9 percent, 0.6 percent and 67.5 percent of total exports respectively. </span></span></span></p>
<p><span style="font-size:11pt"><span style="font-family:Calibri,"sans-serif""><span style="font-size:14.0pt">On the imports side, the share of intermediate goods remained 53.7 percent, capital goods 10.9 percent and final consumption goods 35.4 percent in the review period. Such ratios were 52.6 percent, 12.0 percent and 35.4 percent respectively in the same period of the previous year, the report stated.</span></span></span></p>
',
'published' => true,
'created' => '2022-02-10',
'modified' => '2022-02-10',
'keywords' => '',
'description' => '',
'sortorder' => '14488',
'image' => '20220210025613_Trade.jpg',
'article_date' => '2022-02-10 14:55:28',
'homepage' => false,
'breaking_news' => false,
'main_news' => true,
'in_scroller' => null,
'user_id' => '34'
),
'ArticleCategory' => array(
'id' => '1',
'name' => 'NEWS',
'parentOf' => '0',
'published' => true,
'registered' => '2015-07-20 00:00:00',
'sortorder' => '158',
'del_flag' => '0',
'homepage' => true,
'display_in_menu' => true,
'user_id' => '1',
'created' => '0000-00-00 00:00:00',
'modified' => '2018-11-22 11:58:49'
),
'User' => array(
'password' => '*****',
'id' => '34',
'user_detail_id' => '1',
'group_id' => '1',
'username' => 'neeraj.roy@newbusinessage.com',
'name' => null,
'email' => 'neeraj.roy@newbusinessage.com',
'address' => null,
'gender' => null,
'access' => '1',
'phone' => null,
'access_type' => null,
'activated' => true,
'sortorder' => null,
'published' => null,
'created' => '2020-07-19 16:40:23',
'last_login' => '2024-08-13 13:55:06',
'ip' => '172.69.41.137'
),
'ArticleComment' => array(),
'ArticleFeature' => array(),
'ArticleHasAuthor' => array(),
'ArticleHasTag' => array(),
'ArticleView' => array(
(int) 0 => array(
[maximum depth reached]
)
),
'Slider' => array()
),
'current_user' => null,
'logged_in' => false
)
$article = array(
'Article' => array(
'id' => '14745',
'article_category_id' => '1',
'title' => 'Trade Deficit Increases to Rs 880 Billion',
'sub_title' => '',
'summary' => 'February 10: Nepal’s trade deficit increased by 46.6 percent in the first six months of the current fiscal year to Rs 880.49 billion.',
'content' => '<p><span style="font-size:11pt"><span style="font-family:Calibri,"sans-serif""><span style="font-size:14.0pt">February 10: Nepal’s trade deficit increased by 46.6 percent in the first six months of the current fiscal year to Rs 880.49 billion. According to the Nepal Rastra Bank, the total trade deficit had contracted 5.8 percent in the corresponding period of the previous year. </span></span></span></p>
<p><span style="font-size:11pt"><span style="font-family:Calibri,"sans-serif""><span style="font-size:14.0pt">The Current Macroeconomic and Financial Situation Report unveiled by the central bank on Wednesday states that the export-import ratio increased to 11.9 percent in the review period from 9.2 percent in the corresponding period of the previous year. </span></span></span></p>
<p><span style="font-size:11pt"><span style="font-family:Calibri,"sans-serif""><span style="font-size:14.0pt">During the six months of FY 2021/22, merchandise exports increased 95.5 percent to Rs 118.85 billion compared to an increase of 6.1 percent in the same period of the previous year. </span></span></span></p>
<p><span style="font-size:11pt"><span style="font-family:Calibri,"sans-serif""><span style="font-size:14.0pt">Destination-wise, exports to India and other countries increased 121.8 percent and 30.2 respectively whereas exports to China decreased 10.2 percent. </span></span></span></p>
<p><span style="font-size:11pt"><span style="font-family:Calibri,"sans-serif""><span style="font-size:14.0pt">Exports of palm oil, soybean oil, oil cakes, juice, woolen carpets, among others, increased whereas exports of cardamom, tea, herbs, zinc sheet, wire, among others, decreased in the review period, the report states.</span></span></span></p>
<p><span style="font-size:11pt"><span style="font-family:Calibri,"sans-serif""><span style="font-size:14.0pt">Similarly, merchandise imports during the six months of FY 2021/22 increased 51.1 percent to Rs 999.34 billion against a decrease of 4.8 percent a year ago. Destination-wise, imports from India, China and other countries increased 37.5 percent, 51.5 percent, and 98.2 percent respectively. </span></span></span></p>
<p><span style="font-size:11pt"><span style="font-family:Calibri,"sans-serif""><span style="font-size:14.0pt">According to the NRB report, imports of petroleum products, medicine, crude palm oil, transport equipment, vehicle and other parts, crude soybean oil, among others, increased whereas imports of MS billet, cement, pulses, molasses sugar, insecticides, among others, decreased in the review period. </span></span></span></p>
<p><span style="font-size:11pt"><span style="font-family:Calibri,"sans-serif""><span style="font-size:14.0pt">Based on customs points, exports from Kanchanpur, Mechi, and Nepalgunj customs offices decreased whereas exports from all the other major customs points increased in the review period. On the import side, imports from all the major customs points increased in the review period. </span></span></span></p>
<p> </p>
<p> </p>
<p><span style="font-size:11pt"><span style="font-family:Calibri,"sans-serif""><span style="font-size:14.0pt">During the six months of FY 2021/22, merchandise imports from India by paying convertible foreign currency amounted Rs 110.91 billion. Such amount was Rs 83.01 billion in the same period of the previous year. </span></span></span></p>
<p><span style="font-size:11pt"><span style="font-family:Calibri,"sans-serif""><span style="font-size:14.0pt">As per the Broad Economic Categories (BEC), the intermediate and final consumption goods accounted for 47.8 percent and 52.2 percent of the total exports respectively, whereas the ratio of capital goods in total exports remained negligible at 0.02 percent in the review period.</span></span></span></p>
<p><span style="font-size:11pt"><span style="font-family:Calibri,"sans-serif""><span style="font-size:14.0pt">In the same period of the previous year, the ratio of intermediate, capital and final consumption goods remained 31.9 percent, 0.6 percent and 67.5 percent of total exports respectively. </span></span></span></p>
<p><span style="font-size:11pt"><span style="font-family:Calibri,"sans-serif""><span style="font-size:14.0pt">On the imports side, the share of intermediate goods remained 53.7 percent, capital goods 10.9 percent and final consumption goods 35.4 percent in the review period. Such ratios were 52.6 percent, 12.0 percent and 35.4 percent respectively in the same period of the previous year, the report stated.</span></span></span></p>
',
'published' => true,
'created' => '2022-02-10',
'modified' => '2022-02-10',
'keywords' => '',
'description' => '',
'sortorder' => '14488',
'image' => '20220210025613_Trade.jpg',
'article_date' => '2022-02-10 14:55:28',
'homepage' => false,
'breaking_news' => false,
'main_news' => true,
'in_scroller' => null,
'user_id' => '34'
),
'ArticleCategory' => array(
'id' => '1',
'name' => 'NEWS',
'parentOf' => '0',
'published' => true,
'registered' => '2015-07-20 00:00:00',
'sortorder' => '158',
'del_flag' => '0',
'homepage' => true,
'display_in_menu' => true,
'user_id' => '1',
'created' => '0000-00-00 00:00:00',
'modified' => '2018-11-22 11:58:49'
),
'User' => array(
'password' => '*****',
'id' => '34',
'user_detail_id' => '1',
'group_id' => '1',
'username' => 'neeraj.roy@newbusinessage.com',
'name' => null,
'email' => 'neeraj.roy@newbusinessage.com',
'address' => null,
'gender' => null,
'access' => '1',
'phone' => null,
'access_type' => null,
'activated' => true,
'sortorder' => null,
'published' => null,
'created' => '2020-07-19 16:40:23',
'last_login' => '2024-08-13 13:55:06',
'ip' => '172.69.41.137'
),
'ArticleComment' => array(),
'ArticleFeature' => array(),
'ArticleHasAuthor' => array(),
'ArticleHasTag' => array(),
'ArticleView' => array(
(int) 0 => array(
'article_id' => '14745',
'hit' => '932'
)
),
'Slider' => array()
)
$current_user = null
$logged_in = false
$image = 'https://www.old.newbusinessage.com/app/webroot/img/news/20220210025613_Trade.jpg'
$user = null
$groupId = null
include - APP/View/Articles/view.ctp, line 116
View::_evaluate() - CORE/Cake/View/View.php, line 971
View::_render() - CORE/Cake/View/View.php, line 933
View::render() - CORE/Cake/View/View.php, line 473
Controller::render() - CORE/Cake/Controller/Controller.php, line 968
Dispatcher::_invoke() - CORE/Cake/Routing/Dispatcher.php, line 200
Dispatcher::dispatch() - CORE/Cake/Routing/Dispatcher.php, line 167
[main] - APP/webroot/index.php, line 117
$viewFile = '/var/www/html/newbusinessage.com/app/View/Articles/view.ctp'
$dataForView = array(
'article' => array(
'Article' => array(
'id' => '14745',
'article_category_id' => '1',
'title' => 'Trade Deficit Increases to Rs 880 Billion',
'sub_title' => '',
'summary' => 'February 10: Nepal’s trade deficit increased by 46.6 percent in the first six months of the current fiscal year to Rs 880.49 billion.',
'content' => '<p><span style="font-size:11pt"><span style="font-family:Calibri,"sans-serif""><span style="font-size:14.0pt">February 10: Nepal’s trade deficit increased by 46.6 percent in the first six months of the current fiscal year to Rs 880.49 billion. According to the Nepal Rastra Bank, the total trade deficit had contracted 5.8 percent in the corresponding period of the previous year. </span></span></span></p>
<p><span style="font-size:11pt"><span style="font-family:Calibri,"sans-serif""><span style="font-size:14.0pt">The Current Macroeconomic and Financial Situation Report unveiled by the central bank on Wednesday states that the export-import ratio increased to 11.9 percent in the review period from 9.2 percent in the corresponding period of the previous year. </span></span></span></p>
<p><span style="font-size:11pt"><span style="font-family:Calibri,"sans-serif""><span style="font-size:14.0pt">During the six months of FY 2021/22, merchandise exports increased 95.5 percent to Rs 118.85 billion compared to an increase of 6.1 percent in the same period of the previous year. </span></span></span></p>
<p><span style="font-size:11pt"><span style="font-family:Calibri,"sans-serif""><span style="font-size:14.0pt">Destination-wise, exports to India and other countries increased 121.8 percent and 30.2 respectively whereas exports to China decreased 10.2 percent. </span></span></span></p>
<p><span style="font-size:11pt"><span style="font-family:Calibri,"sans-serif""><span style="font-size:14.0pt">Exports of palm oil, soybean oil, oil cakes, juice, woolen carpets, among others, increased whereas exports of cardamom, tea, herbs, zinc sheet, wire, among others, decreased in the review period, the report states.</span></span></span></p>
<p><span style="font-size:11pt"><span style="font-family:Calibri,"sans-serif""><span style="font-size:14.0pt">Similarly, merchandise imports during the six months of FY 2021/22 increased 51.1 percent to Rs 999.34 billion against a decrease of 4.8 percent a year ago. Destination-wise, imports from India, China and other countries increased 37.5 percent, 51.5 percent, and 98.2 percent respectively. </span></span></span></p>
<p><span style="font-size:11pt"><span style="font-family:Calibri,"sans-serif""><span style="font-size:14.0pt">According to the NRB report, imports of petroleum products, medicine, crude palm oil, transport equipment, vehicle and other parts, crude soybean oil, among others, increased whereas imports of MS billet, cement, pulses, molasses sugar, insecticides, among others, decreased in the review period. </span></span></span></p>
<p><span style="font-size:11pt"><span style="font-family:Calibri,"sans-serif""><span style="font-size:14.0pt">Based on customs points, exports from Kanchanpur, Mechi, and Nepalgunj customs offices decreased whereas exports from all the other major customs points increased in the review period. On the import side, imports from all the major customs points increased in the review period. </span></span></span></p>
<p> </p>
<p> </p>
<p><span style="font-size:11pt"><span style="font-family:Calibri,"sans-serif""><span style="font-size:14.0pt">During the six months of FY 2021/22, merchandise imports from India by paying convertible foreign currency amounted Rs 110.91 billion. Such amount was Rs 83.01 billion in the same period of the previous year. </span></span></span></p>
<p><span style="font-size:11pt"><span style="font-family:Calibri,"sans-serif""><span style="font-size:14.0pt">As per the Broad Economic Categories (BEC), the intermediate and final consumption goods accounted for 47.8 percent and 52.2 percent of the total exports respectively, whereas the ratio of capital goods in total exports remained negligible at 0.02 percent in the review period.</span></span></span></p>
<p><span style="font-size:11pt"><span style="font-family:Calibri,"sans-serif""><span style="font-size:14.0pt">In the same period of the previous year, the ratio of intermediate, capital and final consumption goods remained 31.9 percent, 0.6 percent and 67.5 percent of total exports respectively. </span></span></span></p>
<p><span style="font-size:11pt"><span style="font-family:Calibri,"sans-serif""><span style="font-size:14.0pt">On the imports side, the share of intermediate goods remained 53.7 percent, capital goods 10.9 percent and final consumption goods 35.4 percent in the review period. Such ratios were 52.6 percent, 12.0 percent and 35.4 percent respectively in the same period of the previous year, the report stated.</span></span></span></p>
',
'published' => true,
'created' => '2022-02-10',
'modified' => '2022-02-10',
'keywords' => '',
'description' => '',
'sortorder' => '14488',
'image' => '20220210025613_Trade.jpg',
'article_date' => '2022-02-10 14:55:28',
'homepage' => false,
'breaking_news' => false,
'main_news' => true,
'in_scroller' => null,
'user_id' => '34'
),
'ArticleCategory' => array(
'id' => '1',
'name' => 'NEWS',
'parentOf' => '0',
'published' => true,
'registered' => '2015-07-20 00:00:00',
'sortorder' => '158',
'del_flag' => '0',
'homepage' => true,
'display_in_menu' => true,
'user_id' => '1',
'created' => '0000-00-00 00:00:00',
'modified' => '2018-11-22 11:58:49'
),
'User' => array(
'password' => '*****',
'id' => '34',
'user_detail_id' => '1',
'group_id' => '1',
'username' => 'neeraj.roy@newbusinessage.com',
'name' => null,
'email' => 'neeraj.roy@newbusinessage.com',
'address' => null,
'gender' => null,
'access' => '1',
'phone' => null,
'access_type' => null,
'activated' => true,
'sortorder' => null,
'published' => null,
'created' => '2020-07-19 16:40:23',
'last_login' => '2024-08-13 13:55:06',
'ip' => '172.69.41.137'
),
'ArticleComment' => array(),
'ArticleFeature' => array(),
'ArticleHasAuthor' => array(),
'ArticleHasTag' => array(),
'ArticleView' => array(
(int) 0 => array(
[maximum depth reached]
)
),
'Slider' => array()
),
'current_user' => null,
'logged_in' => false
)
$article = array(
'Article' => array(
'id' => '14745',
'article_category_id' => '1',
'title' => 'Trade Deficit Increases to Rs 880 Billion',
'sub_title' => '',
'summary' => 'February 10: Nepal’s trade deficit increased by 46.6 percent in the first six months of the current fiscal year to Rs 880.49 billion.',
'content' => '<p><span style="font-size:11pt"><span style="font-family:Calibri,"sans-serif""><span style="font-size:14.0pt">February 10: Nepal’s trade deficit increased by 46.6 percent in the first six months of the current fiscal year to Rs 880.49 billion. According to the Nepal Rastra Bank, the total trade deficit had contracted 5.8 percent in the corresponding period of the previous year. </span></span></span></p>
<p><span style="font-size:11pt"><span style="font-family:Calibri,"sans-serif""><span style="font-size:14.0pt">The Current Macroeconomic and Financial Situation Report unveiled by the central bank on Wednesday states that the export-import ratio increased to 11.9 percent in the review period from 9.2 percent in the corresponding period of the previous year. </span></span></span></p>
<p><span style="font-size:11pt"><span style="font-family:Calibri,"sans-serif""><span style="font-size:14.0pt">During the six months of FY 2021/22, merchandise exports increased 95.5 percent to Rs 118.85 billion compared to an increase of 6.1 percent in the same period of the previous year. </span></span></span></p>
<p><span style="font-size:11pt"><span style="font-family:Calibri,"sans-serif""><span style="font-size:14.0pt">Destination-wise, exports to India and other countries increased 121.8 percent and 30.2 respectively whereas exports to China decreased 10.2 percent. </span></span></span></p>
<p><span style="font-size:11pt"><span style="font-family:Calibri,"sans-serif""><span style="font-size:14.0pt">Exports of palm oil, soybean oil, oil cakes, juice, woolen carpets, among others, increased whereas exports of cardamom, tea, herbs, zinc sheet, wire, among others, decreased in the review period, the report states.</span></span></span></p>
<p><span style="font-size:11pt"><span style="font-family:Calibri,"sans-serif""><span style="font-size:14.0pt">Similarly, merchandise imports during the six months of FY 2021/22 increased 51.1 percent to Rs 999.34 billion against a decrease of 4.8 percent a year ago. Destination-wise, imports from India, China and other countries increased 37.5 percent, 51.5 percent, and 98.2 percent respectively. </span></span></span></p>
<p><span style="font-size:11pt"><span style="font-family:Calibri,"sans-serif""><span style="font-size:14.0pt">According to the NRB report, imports of petroleum products, medicine, crude palm oil, transport equipment, vehicle and other parts, crude soybean oil, among others, increased whereas imports of MS billet, cement, pulses, molasses sugar, insecticides, among others, decreased in the review period. </span></span></span></p>
<p><span style="font-size:11pt"><span style="font-family:Calibri,"sans-serif""><span style="font-size:14.0pt">Based on customs points, exports from Kanchanpur, Mechi, and Nepalgunj customs offices decreased whereas exports from all the other major customs points increased in the review period. On the import side, imports from all the major customs points increased in the review period. </span></span></span></p>
<p> </p>
<p> </p>
<p><span style="font-size:11pt"><span style="font-family:Calibri,"sans-serif""><span style="font-size:14.0pt">During the six months of FY 2021/22, merchandise imports from India by paying convertible foreign currency amounted Rs 110.91 billion. Such amount was Rs 83.01 billion in the same period of the previous year. </span></span></span></p>
<p><span style="font-size:11pt"><span style="font-family:Calibri,"sans-serif""><span style="font-size:14.0pt">As per the Broad Economic Categories (BEC), the intermediate and final consumption goods accounted for 47.8 percent and 52.2 percent of the total exports respectively, whereas the ratio of capital goods in total exports remained negligible at 0.02 percent in the review period.</span></span></span></p>
<p><span style="font-size:11pt"><span style="font-family:Calibri,"sans-serif""><span style="font-size:14.0pt">In the same period of the previous year, the ratio of intermediate, capital and final consumption goods remained 31.9 percent, 0.6 percent and 67.5 percent of total exports respectively. </span></span></span></p>
<p><span style="font-size:11pt"><span style="font-family:Calibri,"sans-serif""><span style="font-size:14.0pt">On the imports side, the share of intermediate goods remained 53.7 percent, capital goods 10.9 percent and final consumption goods 35.4 percent in the review period. Such ratios were 52.6 percent, 12.0 percent and 35.4 percent respectively in the same period of the previous year, the report stated.</span></span></span></p>
',
'published' => true,
'created' => '2022-02-10',
'modified' => '2022-02-10',
'keywords' => '',
'description' => '',
'sortorder' => '14488',
'image' => '20220210025613_Trade.jpg',
'article_date' => '2022-02-10 14:55:28',
'homepage' => false,
'breaking_news' => false,
'main_news' => true,
'in_scroller' => null,
'user_id' => '34'
),
'ArticleCategory' => array(
'id' => '1',
'name' => 'NEWS',
'parentOf' => '0',
'published' => true,
'registered' => '2015-07-20 00:00:00',
'sortorder' => '158',
'del_flag' => '0',
'homepage' => true,
'display_in_menu' => true,
'user_id' => '1',
'created' => '0000-00-00 00:00:00',
'modified' => '2018-11-22 11:58:49'
),
'User' => array(
'password' => '*****',
'id' => '34',
'user_detail_id' => '1',
'group_id' => '1',
'username' => 'neeraj.roy@newbusinessage.com',
'name' => null,
'email' => 'neeraj.roy@newbusinessage.com',
'address' => null,
'gender' => null,
'access' => '1',
'phone' => null,
'access_type' => null,
'activated' => true,
'sortorder' => null,
'published' => null,
'created' => '2020-07-19 16:40:23',
'last_login' => '2024-08-13 13:55:06',
'ip' => '172.69.41.137'
),
'ArticleComment' => array(),
'ArticleFeature' => array(),
'ArticleHasAuthor' => array(),
'ArticleHasTag' => array(),
'ArticleView' => array(
(int) 0 => array(
'article_id' => '14745',
'hit' => '932'
)
),
'Slider' => array()
)
$current_user = null
$logged_in = false
$image = 'https://www.old.newbusinessage.com/app/webroot/img/news/20220210025613_Trade.jpg'
$user = null
$groupId = null
$user_id = null
$date = '2022-02-10 14:55:28'
$dateFromDatabase = (int) 1644484228
$newDate = 'Feb 10, 2022'
$articleView = array(
'article_id' => '14745',
'hit' => '932'
)
$word_count = (int) 662
$time_to_read = (float) 3.31
$time_to_read_min = (float) 3
$time_to_read_second = (float) 19
include - APP/View/Articles/view.ctp, line 241
View::_evaluate() - CORE/Cake/View/View.php, line 971
View::_render() - CORE/Cake/View/View.php, line 933
View::render() - CORE/Cake/View/View.php, line 473
Controller::render() - CORE/Cake/Controller/Controller.php, line 968
Dispatcher::_invoke() - CORE/Cake/Routing/Dispatcher.php, line 200
Dispatcher::dispatch() - CORE/Cake/Routing/Dispatcher.php, line 167
[main] - APP/webroot/index.php, line 117
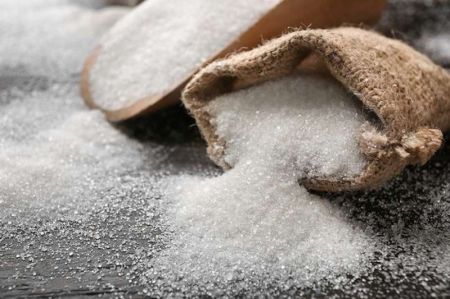
February 10: Nepal’s trade deficit increased by 46.6 percent in the first six months of the current fiscal year to Rs 880.49 billion. According to the Nepal Rastra Bank, the total trade deficit had contracted 5.8 percent in the corresponding period of the previous year.
The Current Macroeconomic and Financial Situation Report unveiled by the central bank on Wednesday states that the export-import ratio increased to 11.9 percent in the review period from 9.2 percent in the corresponding period of the previous year.
During the six months of FY 2021/22, merchandise exports increased 95.5 percent to Rs 118.85 billion compared to an increase of 6.1 percent in the same period of the previous year.
Destination-wise, exports to India and other countries increased 121.8 percent and 30.2 respectively whereas exports to China decreased 10.2 percent.
Exports of palm oil, soybean oil, oil cakes, juice, woolen carpets, among others, increased whereas exports of cardamom, tea, herbs, zinc sheet, wire, among others, decreased in the review period, the report states.
Similarly, merchandise imports during the six months of FY 2021/22 increased 51.1 percent to Rs 999.34 billion against a decrease of 4.8 percent a year ago. Destination-wise, imports from India, China and other countries increased 37.5 percent, 51.5 percent, and 98.2 percent respectively.
According to the NRB report, imports of petroleum products, medicine, crude palm oil, transport equipment, vehicle and other parts, crude soybean oil, among others, increased whereas imports of MS billet, cement, pulses, molasses sugar, insecticides, among others, decreased in the review period.
Based on customs points, exports from Kanchanpur, Mechi, and Nepalgunj customs offices decreased whereas exports from all the other major customs points increased in the review period. On the import side, imports from all the major customs points increased in the review period.
During the six months of FY 2021/22, merchandise imports from India by paying convertible foreign currency amounted Rs 110.91 billion. Such amount was Rs 83.01 billion in the same period of the previous year.
As per the Broad Economic Categories (BEC), the intermediate and final consumption goods accounted for 47.8 percent and 52.2 percent of the total exports respectively, whereas the ratio of capital goods in total exports remained negligible at 0.02 percent in the review period.
In the same period of the previous year, the ratio of intermediate, capital and final consumption goods remained 31.9 percent, 0.6 percent and 67.5 percent of total exports respectively.
On the imports side, the share of intermediate goods remained 53.7 percent, capital goods 10.9 percent and final consumption goods 35.4 percent in the review period. Such ratios were 52.6 percent, 12.0 percent and 35.4 percent respectively in the same period of the previous year, the report stated.
FormHelper::create() - CORE/Cake/View/Helper/FormHelper.php, line 383
include - APP/View/Articles/view.ctp, line 273
View::_evaluate() - CORE/Cake/View/View.php, line 971
View::_render() - CORE/Cake/View/View.php, line 933
View::render() - CORE/Cake/View/View.php, line 473
Controller::render() - CORE/Cake/Controller/Controller.php, line 968
Dispatcher::_invoke() - CORE/Cake/Routing/Dispatcher.php, line 200
Dispatcher::dispatch() - CORE/Cake/Routing/Dispatcher.php, line 167
[main] - APP/webroot/index.php, line 117
$viewFile = '/var/www/html/newbusinessage.com/app/View/Elements/side_bar.ctp'
$dataForView = array(
'article' => array(
'Article' => array(
'id' => '14745',
'article_category_id' => '1',
'title' => 'Trade Deficit Increases to Rs 880 Billion',
'sub_title' => '',
'summary' => 'February 10: Nepal’s trade deficit increased by 46.6 percent in the first six months of the current fiscal year to Rs 880.49 billion.',
'content' => '<p><span style="font-size:11pt"><span style="font-family:Calibri,"sans-serif""><span style="font-size:14.0pt">February 10: Nepal’s trade deficit increased by 46.6 percent in the first six months of the current fiscal year to Rs 880.49 billion. According to the Nepal Rastra Bank, the total trade deficit had contracted 5.8 percent in the corresponding period of the previous year. </span></span></span></p>
<p><span style="font-size:11pt"><span style="font-family:Calibri,"sans-serif""><span style="font-size:14.0pt">The Current Macroeconomic and Financial Situation Report unveiled by the central bank on Wednesday states that the export-import ratio increased to 11.9 percent in the review period from 9.2 percent in the corresponding period of the previous year. </span></span></span></p>
<p><span style="font-size:11pt"><span style="font-family:Calibri,"sans-serif""><span style="font-size:14.0pt">During the six months of FY 2021/22, merchandise exports increased 95.5 percent to Rs 118.85 billion compared to an increase of 6.1 percent in the same period of the previous year. </span></span></span></p>
<p><span style="font-size:11pt"><span style="font-family:Calibri,"sans-serif""><span style="font-size:14.0pt">Destination-wise, exports to India and other countries increased 121.8 percent and 30.2 respectively whereas exports to China decreased 10.2 percent. </span></span></span></p>
<p><span style="font-size:11pt"><span style="font-family:Calibri,"sans-serif""><span style="font-size:14.0pt">Exports of palm oil, soybean oil, oil cakes, juice, woolen carpets, among others, increased whereas exports of cardamom, tea, herbs, zinc sheet, wire, among others, decreased in the review period, the report states.</span></span></span></p>
<p><span style="font-size:11pt"><span style="font-family:Calibri,"sans-serif""><span style="font-size:14.0pt">Similarly, merchandise imports during the six months of FY 2021/22 increased 51.1 percent to Rs 999.34 billion against a decrease of 4.8 percent a year ago. Destination-wise, imports from India, China and other countries increased 37.5 percent, 51.5 percent, and 98.2 percent respectively. </span></span></span></p>
<p><span style="font-size:11pt"><span style="font-family:Calibri,"sans-serif""><span style="font-size:14.0pt">According to the NRB report, imports of petroleum products, medicine, crude palm oil, transport equipment, vehicle and other parts, crude soybean oil, among others, increased whereas imports of MS billet, cement, pulses, molasses sugar, insecticides, among others, decreased in the review period. </span></span></span></p>
<p><span style="font-size:11pt"><span style="font-family:Calibri,"sans-serif""><span style="font-size:14.0pt">Based on customs points, exports from Kanchanpur, Mechi, and Nepalgunj customs offices decreased whereas exports from all the other major customs points increased in the review period. On the import side, imports from all the major customs points increased in the review period. </span></span></span></p>
<p> </p>
<p> </p>
<p><span style="font-size:11pt"><span style="font-family:Calibri,"sans-serif""><span style="font-size:14.0pt">During the six months of FY 2021/22, merchandise imports from India by paying convertible foreign currency amounted Rs 110.91 billion. Such amount was Rs 83.01 billion in the same period of the previous year. </span></span></span></p>
<p><span style="font-size:11pt"><span style="font-family:Calibri,"sans-serif""><span style="font-size:14.0pt">As per the Broad Economic Categories (BEC), the intermediate and final consumption goods accounted for 47.8 percent and 52.2 percent of the total exports respectively, whereas the ratio of capital goods in total exports remained negligible at 0.02 percent in the review period.</span></span></span></p>
<p><span style="font-size:11pt"><span style="font-family:Calibri,"sans-serif""><span style="font-size:14.0pt">In the same period of the previous year, the ratio of intermediate, capital and final consumption goods remained 31.9 percent, 0.6 percent and 67.5 percent of total exports respectively. </span></span></span></p>
<p><span style="font-size:11pt"><span style="font-family:Calibri,"sans-serif""><span style="font-size:14.0pt">On the imports side, the share of intermediate goods remained 53.7 percent, capital goods 10.9 percent and final consumption goods 35.4 percent in the review period. Such ratios were 52.6 percent, 12.0 percent and 35.4 percent respectively in the same period of the previous year, the report stated.</span></span></span></p>
',
'published' => true,
'created' => '2022-02-10',
'modified' => '2022-02-10',
'keywords' => '',
'description' => '',
'sortorder' => '14488',
'image' => '20220210025613_Trade.jpg',
'article_date' => '2022-02-10 14:55:28',
'homepage' => false,
'breaking_news' => false,
'main_news' => true,
'in_scroller' => null,
'user_id' => '34'
),
'ArticleCategory' => array(
'id' => '1',
'name' => 'NEWS',
'parentOf' => '0',
'published' => true,
'registered' => '2015-07-20 00:00:00',
'sortorder' => '158',
'del_flag' => '0',
'homepage' => true,
'display_in_menu' => true,
'user_id' => '1',
'created' => '0000-00-00 00:00:00',
'modified' => '2018-11-22 11:58:49'
),
'User' => array(
'password' => '*****',
'id' => '34',
'user_detail_id' => '1',
'group_id' => '1',
'username' => 'neeraj.roy@newbusinessage.com',
'name' => null,
'email' => 'neeraj.roy@newbusinessage.com',
'address' => null,
'gender' => null,
'access' => '1',
'phone' => null,
'access_type' => null,
'activated' => true,
'sortorder' => null,
'published' => null,
'created' => '2020-07-19 16:40:23',
'last_login' => '2024-08-13 13:55:06',
'ip' => '172.69.41.137'
),
'ArticleComment' => array(),
'ArticleFeature' => array(),
'ArticleHasAuthor' => array(),
'ArticleHasTag' => array(),
'ArticleView' => array(
(int) 0 => array(
[maximum depth reached]
)
),
'Slider' => array()
),
'current_user' => null,
'logged_in' => false
)
$article = array(
'Article' => array(
'id' => '14745',
'article_category_id' => '1',
'title' => 'Trade Deficit Increases to Rs 880 Billion',
'sub_title' => '',
'summary' => 'February 10: Nepal’s trade deficit increased by 46.6 percent in the first six months of the current fiscal year to Rs 880.49 billion.',
'content' => '<p><span style="font-size:11pt"><span style="font-family:Calibri,"sans-serif""><span style="font-size:14.0pt">February 10: Nepal’s trade deficit increased by 46.6 percent in the first six months of the current fiscal year to Rs 880.49 billion. According to the Nepal Rastra Bank, the total trade deficit had contracted 5.8 percent in the corresponding period of the previous year. </span></span></span></p>
<p><span style="font-size:11pt"><span style="font-family:Calibri,"sans-serif""><span style="font-size:14.0pt">The Current Macroeconomic and Financial Situation Report unveiled by the central bank on Wednesday states that the export-import ratio increased to 11.9 percent in the review period from 9.2 percent in the corresponding period of the previous year. </span></span></span></p>
<p><span style="font-size:11pt"><span style="font-family:Calibri,"sans-serif""><span style="font-size:14.0pt">During the six months of FY 2021/22, merchandise exports increased 95.5 percent to Rs 118.85 billion compared to an increase of 6.1 percent in the same period of the previous year. </span></span></span></p>
<p><span style="font-size:11pt"><span style="font-family:Calibri,"sans-serif""><span style="font-size:14.0pt">Destination-wise, exports to India and other countries increased 121.8 percent and 30.2 respectively whereas exports to China decreased 10.2 percent. </span></span></span></p>
<p><span style="font-size:11pt"><span style="font-family:Calibri,"sans-serif""><span style="font-size:14.0pt">Exports of palm oil, soybean oil, oil cakes, juice, woolen carpets, among others, increased whereas exports of cardamom, tea, herbs, zinc sheet, wire, among others, decreased in the review period, the report states.</span></span></span></p>
<p><span style="font-size:11pt"><span style="font-family:Calibri,"sans-serif""><span style="font-size:14.0pt">Similarly, merchandise imports during the six months of FY 2021/22 increased 51.1 percent to Rs 999.34 billion against a decrease of 4.8 percent a year ago. Destination-wise, imports from India, China and other countries increased 37.5 percent, 51.5 percent, and 98.2 percent respectively. </span></span></span></p>
<p><span style="font-size:11pt"><span style="font-family:Calibri,"sans-serif""><span style="font-size:14.0pt">According to the NRB report, imports of petroleum products, medicine, crude palm oil, transport equipment, vehicle and other parts, crude soybean oil, among others, increased whereas imports of MS billet, cement, pulses, molasses sugar, insecticides, among others, decreased in the review period. </span></span></span></p>
<p><span style="font-size:11pt"><span style="font-family:Calibri,"sans-serif""><span style="font-size:14.0pt">Based on customs points, exports from Kanchanpur, Mechi, and Nepalgunj customs offices decreased whereas exports from all the other major customs points increased in the review period. On the import side, imports from all the major customs points increased in the review period. </span></span></span></p>
<p> </p>
<p> </p>
<p><span style="font-size:11pt"><span style="font-family:Calibri,"sans-serif""><span style="font-size:14.0pt">During the six months of FY 2021/22, merchandise imports from India by paying convertible foreign currency amounted Rs 110.91 billion. Such amount was Rs 83.01 billion in the same period of the previous year. </span></span></span></p>
<p><span style="font-size:11pt"><span style="font-family:Calibri,"sans-serif""><span style="font-size:14.0pt">As per the Broad Economic Categories (BEC), the intermediate and final consumption goods accounted for 47.8 percent and 52.2 percent of the total exports respectively, whereas the ratio of capital goods in total exports remained negligible at 0.02 percent in the review period.</span></span></span></p>
<p><span style="font-size:11pt"><span style="font-family:Calibri,"sans-serif""><span style="font-size:14.0pt">In the same period of the previous year, the ratio of intermediate, capital and final consumption goods remained 31.9 percent, 0.6 percent and 67.5 percent of total exports respectively. </span></span></span></p>
<p><span style="font-size:11pt"><span style="font-family:Calibri,"sans-serif""><span style="font-size:14.0pt">On the imports side, the share of intermediate goods remained 53.7 percent, capital goods 10.9 percent and final consumption goods 35.4 percent in the review period. Such ratios were 52.6 percent, 12.0 percent and 35.4 percent respectively in the same period of the previous year, the report stated.</span></span></span></p>
',
'published' => true,
'created' => '2022-02-10',
'modified' => '2022-02-10',
'keywords' => '',
'description' => '',
'sortorder' => '14488',
'image' => '20220210025613_Trade.jpg',
'article_date' => '2022-02-10 14:55:28',
'homepage' => false,
'breaking_news' => false,
'main_news' => true,
'in_scroller' => null,
'user_id' => '34'
),
'ArticleCategory' => array(
'id' => '1',
'name' => 'NEWS',
'parentOf' => '0',
'published' => true,
'registered' => '2015-07-20 00:00:00',
'sortorder' => '158',
'del_flag' => '0',
'homepage' => true,
'display_in_menu' => true,
'user_id' => '1',
'created' => '0000-00-00 00:00:00',
'modified' => '2018-11-22 11:58:49'
),
'User' => array(
'password' => '*****',
'id' => '34',
'user_detail_id' => '1',
'group_id' => '1',
'username' => 'neeraj.roy@newbusinessage.com',
'name' => null,
'email' => 'neeraj.roy@newbusinessage.com',
'address' => null,
'gender' => null,
'access' => '1',
'phone' => null,
'access_type' => null,
'activated' => true,
'sortorder' => null,
'published' => null,
'created' => '2020-07-19 16:40:23',
'last_login' => '2024-08-13 13:55:06',
'ip' => '172.69.41.137'
),
'ArticleComment' => array(),
'ArticleFeature' => array(),
'ArticleHasAuthor' => array(),
'ArticleHasTag' => array(),
'ArticleView' => array(
(int) 0 => array(
'article_id' => '14745',
'hit' => '932'
)
),
'Slider' => array()
)
$current_user = null
$logged_in = false
include - APP/View/Elements/side_bar.ctp, line 60
View::_evaluate() - CORE/Cake/View/View.php, line 971
View::_render() - CORE/Cake/View/View.php, line 933
View::_renderElement() - CORE/Cake/View/View.php, line 1224
View::element() - CORE/Cake/View/View.php, line 418
include - APP/View/Articles/view.ctp, line 391
View::_evaluate() - CORE/Cake/View/View.php, line 971
View::_render() - CORE/Cake/View/View.php, line 933
View::render() - CORE/Cake/View/View.php, line 473
Controller::render() - CORE/Cake/Controller/Controller.php, line 968
Dispatcher::_invoke() - CORE/Cake/Routing/Dispatcher.php, line 200
Dispatcher::dispatch() - CORE/Cake/Routing/Dispatcher.php, line 167
[main] - APP/webroot/index.php, line 117
Warning (2): simplexml_load_file() [<a href='http://php.net/function.simplexml-load-file'>function.simplexml-load-file</a>]: I/O warning : failed to load external entity "" [APP/View/Elements/side_bar.ctp, line 60]
$viewFile = '/var/www/html/newbusinessage.com/app/View/Elements/side_bar.ctp'
$dataForView = array(
'article' => array(
'Article' => array(
'id' => '14745',
'article_category_id' => '1',
'title' => 'Trade Deficit Increases to Rs 880 Billion',
'sub_title' => '',
'summary' => 'February 10: Nepal’s trade deficit increased by 46.6 percent in the first six months of the current fiscal year to Rs 880.49 billion.',
'content' => '<p><span style="font-size:11pt"><span style="font-family:Calibri,"sans-serif""><span style="font-size:14.0pt">February 10: Nepal’s trade deficit increased by 46.6 percent in the first six months of the current fiscal year to Rs 880.49 billion. According to the Nepal Rastra Bank, the total trade deficit had contracted 5.8 percent in the corresponding period of the previous year. </span></span></span></p>
<p><span style="font-size:11pt"><span style="font-family:Calibri,"sans-serif""><span style="font-size:14.0pt">The Current Macroeconomic and Financial Situation Report unveiled by the central bank on Wednesday states that the export-import ratio increased to 11.9 percent in the review period from 9.2 percent in the corresponding period of the previous year. </span></span></span></p>
<p><span style="font-size:11pt"><span style="font-family:Calibri,"sans-serif""><span style="font-size:14.0pt">During the six months of FY 2021/22, merchandise exports increased 95.5 percent to Rs 118.85 billion compared to an increase of 6.1 percent in the same period of the previous year. </span></span></span></p>
<p><span style="font-size:11pt"><span style="font-family:Calibri,"sans-serif""><span style="font-size:14.0pt">Destination-wise, exports to India and other countries increased 121.8 percent and 30.2 respectively whereas exports to China decreased 10.2 percent. </span></span></span></p>
<p><span style="font-size:11pt"><span style="font-family:Calibri,"sans-serif""><span style="font-size:14.0pt">Exports of palm oil, soybean oil, oil cakes, juice, woolen carpets, among others, increased whereas exports of cardamom, tea, herbs, zinc sheet, wire, among others, decreased in the review period, the report states.</span></span></span></p>
<p><span style="font-size:11pt"><span style="font-family:Calibri,"sans-serif""><span style="font-size:14.0pt">Similarly, merchandise imports during the six months of FY 2021/22 increased 51.1 percent to Rs 999.34 billion against a decrease of 4.8 percent a year ago. Destination-wise, imports from India, China and other countries increased 37.5 percent, 51.5 percent, and 98.2 percent respectively. </span></span></span></p>
<p><span style="font-size:11pt"><span style="font-family:Calibri,"sans-serif""><span style="font-size:14.0pt">According to the NRB report, imports of petroleum products, medicine, crude palm oil, transport equipment, vehicle and other parts, crude soybean oil, among others, increased whereas imports of MS billet, cement, pulses, molasses sugar, insecticides, among others, decreased in the review period. </span></span></span></p>
<p><span style="font-size:11pt"><span style="font-family:Calibri,"sans-serif""><span style="font-size:14.0pt">Based on customs points, exports from Kanchanpur, Mechi, and Nepalgunj customs offices decreased whereas exports from all the other major customs points increased in the review period. On the import side, imports from all the major customs points increased in the review period. </span></span></span></p>
<p> </p>
<p> </p>
<p><span style="font-size:11pt"><span style="font-family:Calibri,"sans-serif""><span style="font-size:14.0pt">During the six months of FY 2021/22, merchandise imports from India by paying convertible foreign currency amounted Rs 110.91 billion. Such amount was Rs 83.01 billion in the same period of the previous year. </span></span></span></p>
<p><span style="font-size:11pt"><span style="font-family:Calibri,"sans-serif""><span style="font-size:14.0pt">As per the Broad Economic Categories (BEC), the intermediate and final consumption goods accounted for 47.8 percent and 52.2 percent of the total exports respectively, whereas the ratio of capital goods in total exports remained negligible at 0.02 percent in the review period.</span></span></span></p>
<p><span style="font-size:11pt"><span style="font-family:Calibri,"sans-serif""><span style="font-size:14.0pt">In the same period of the previous year, the ratio of intermediate, capital and final consumption goods remained 31.9 percent, 0.6 percent and 67.5 percent of total exports respectively. </span></span></span></p>
<p><span style="font-size:11pt"><span style="font-family:Calibri,"sans-serif""><span style="font-size:14.0pt">On the imports side, the share of intermediate goods remained 53.7 percent, capital goods 10.9 percent and final consumption goods 35.4 percent in the review period. Such ratios were 52.6 percent, 12.0 percent and 35.4 percent respectively in the same period of the previous year, the report stated.</span></span></span></p>
',
'published' => true,
'created' => '2022-02-10',
'modified' => '2022-02-10',
'keywords' => '',
'description' => '',
'sortorder' => '14488',
'image' => '20220210025613_Trade.jpg',
'article_date' => '2022-02-10 14:55:28',
'homepage' => false,
'breaking_news' => false,
'main_news' => true,
'in_scroller' => null,
'user_id' => '34'
),
'ArticleCategory' => array(
'id' => '1',
'name' => 'NEWS',
'parentOf' => '0',
'published' => true,
'registered' => '2015-07-20 00:00:00',
'sortorder' => '158',
'del_flag' => '0',
'homepage' => true,
'display_in_menu' => true,
'user_id' => '1',
'created' => '0000-00-00 00:00:00',
'modified' => '2018-11-22 11:58:49'
),
'User' => array(
'password' => '*****',
'id' => '34',
'user_detail_id' => '1',
'group_id' => '1',
'username' => 'neeraj.roy@newbusinessage.com',
'name' => null,
'email' => 'neeraj.roy@newbusinessage.com',
'address' => null,
'gender' => null,
'access' => '1',
'phone' => null,
'access_type' => null,
'activated' => true,
'sortorder' => null,
'published' => null,
'created' => '2020-07-19 16:40:23',
'last_login' => '2024-08-13 13:55:06',
'ip' => '172.69.41.137'
),
'ArticleComment' => array(),
'ArticleFeature' => array(),
'ArticleHasAuthor' => array(),
'ArticleHasTag' => array(),
'ArticleView' => array(
(int) 0 => array(
[maximum depth reached]
)
),
'Slider' => array()
),
'current_user' => null,
'logged_in' => false
)
$article = array(
'Article' => array(
'id' => '14745',
'article_category_id' => '1',
'title' => 'Trade Deficit Increases to Rs 880 Billion',
'sub_title' => '',
'summary' => 'February 10: Nepal’s trade deficit increased by 46.6 percent in the first six months of the current fiscal year to Rs 880.49 billion.',
'content' => '<p><span style="font-size:11pt"><span style="font-family:Calibri,"sans-serif""><span style="font-size:14.0pt">February 10: Nepal’s trade deficit increased by 46.6 percent in the first six months of the current fiscal year to Rs 880.49 billion. According to the Nepal Rastra Bank, the total trade deficit had contracted 5.8 percent in the corresponding period of the previous year. </span></span></span></p>
<p><span style="font-size:11pt"><span style="font-family:Calibri,"sans-serif""><span style="font-size:14.0pt">The Current Macroeconomic and Financial Situation Report unveiled by the central bank on Wednesday states that the export-import ratio increased to 11.9 percent in the review period from 9.2 percent in the corresponding period of the previous year. </span></span></span></p>
<p><span style="font-size:11pt"><span style="font-family:Calibri,"sans-serif""><span style="font-size:14.0pt">During the six months of FY 2021/22, merchandise exports increased 95.5 percent to Rs 118.85 billion compared to an increase of 6.1 percent in the same period of the previous year. </span></span></span></p>
<p><span style="font-size:11pt"><span style="font-family:Calibri,"sans-serif""><span style="font-size:14.0pt">Destination-wise, exports to India and other countries increased 121.8 percent and 30.2 respectively whereas exports to China decreased 10.2 percent. </span></span></span></p>
<p><span style="font-size:11pt"><span style="font-family:Calibri,"sans-serif""><span style="font-size:14.0pt">Exports of palm oil, soybean oil, oil cakes, juice, woolen carpets, among others, increased whereas exports of cardamom, tea, herbs, zinc sheet, wire, among others, decreased in the review period, the report states.</span></span></span></p>
<p><span style="font-size:11pt"><span style="font-family:Calibri,"sans-serif""><span style="font-size:14.0pt">Similarly, merchandise imports during the six months of FY 2021/22 increased 51.1 percent to Rs 999.34 billion against a decrease of 4.8 percent a year ago. Destination-wise, imports from India, China and other countries increased 37.5 percent, 51.5 percent, and 98.2 percent respectively. </span></span></span></p>
<p><span style="font-size:11pt"><span style="font-family:Calibri,"sans-serif""><span style="font-size:14.0pt">According to the NRB report, imports of petroleum products, medicine, crude palm oil, transport equipment, vehicle and other parts, crude soybean oil, among others, increased whereas imports of MS billet, cement, pulses, molasses sugar, insecticides, among others, decreased in the review period. </span></span></span></p>
<p><span style="font-size:11pt"><span style="font-family:Calibri,"sans-serif""><span style="font-size:14.0pt">Based on customs points, exports from Kanchanpur, Mechi, and Nepalgunj customs offices decreased whereas exports from all the other major customs points increased in the review period. On the import side, imports from all the major customs points increased in the review period. </span></span></span></p>
<p> </p>
<p> </p>
<p><span style="font-size:11pt"><span style="font-family:Calibri,"sans-serif""><span style="font-size:14.0pt">During the six months of FY 2021/22, merchandise imports from India by paying convertible foreign currency amounted Rs 110.91 billion. Such amount was Rs 83.01 billion in the same period of the previous year. </span></span></span></p>
<p><span style="font-size:11pt"><span style="font-family:Calibri,"sans-serif""><span style="font-size:14.0pt">As per the Broad Economic Categories (BEC), the intermediate and final consumption goods accounted for 47.8 percent and 52.2 percent of the total exports respectively, whereas the ratio of capital goods in total exports remained negligible at 0.02 percent in the review period.</span></span></span></p>
<p><span style="font-size:11pt"><span style="font-family:Calibri,"sans-serif""><span style="font-size:14.0pt">In the same period of the previous year, the ratio of intermediate, capital and final consumption goods remained 31.9 percent, 0.6 percent and 67.5 percent of total exports respectively. </span></span></span></p>
<p><span style="font-size:11pt"><span style="font-family:Calibri,"sans-serif""><span style="font-size:14.0pt">On the imports side, the share of intermediate goods remained 53.7 percent, capital goods 10.9 percent and final consumption goods 35.4 percent in the review period. Such ratios were 52.6 percent, 12.0 percent and 35.4 percent respectively in the same period of the previous year, the report stated.</span></span></span></p>
',
'published' => true,
'created' => '2022-02-10',
'modified' => '2022-02-10',
'keywords' => '',
'description' => '',
'sortorder' => '14488',
'image' => '20220210025613_Trade.jpg',
'article_date' => '2022-02-10 14:55:28',
'homepage' => false,
'breaking_news' => false,
'main_news' => true,
'in_scroller' => null,
'user_id' => '34'
),
'ArticleCategory' => array(
'id' => '1',
'name' => 'NEWS',
'parentOf' => '0',
'published' => true,
'registered' => '2015-07-20 00:00:00',
'sortorder' => '158',
'del_flag' => '0',
'homepage' => true,
'display_in_menu' => true,
'user_id' => '1',
'created' => '0000-00-00 00:00:00',
'modified' => '2018-11-22 11:58:49'
),
'User' => array(
'password' => '*****',
'id' => '34',
'user_detail_id' => '1',
'group_id' => '1',
'username' => 'neeraj.roy@newbusinessage.com',
'name' => null,
'email' => 'neeraj.roy@newbusinessage.com',
'address' => null,
'gender' => null,
'access' => '1',
'phone' => null,
'access_type' => null,
'activated' => true,
'sortorder' => null,
'published' => null,
'created' => '2020-07-19 16:40:23',
'last_login' => '2024-08-13 13:55:06',
'ip' => '172.69.41.137'
),
'ArticleComment' => array(),
'ArticleFeature' => array(),
'ArticleHasAuthor' => array(),
'ArticleHasTag' => array(),
'ArticleView' => array(
(int) 0 => array(
'article_id' => '14745',
'hit' => '932'
)
),
'Slider' => array()
)
$current_user = null
$logged_in = false
simplexml_load_file - [internal], line ??
include - APP/View/Elements/side_bar.ctp, line 60
View::_evaluate() - CORE/Cake/View/View.php, line 971
View::_render() - CORE/Cake/View/View.php, line 933
View::_renderElement() - CORE/Cake/View/View.php, line 1224
View::element() - CORE/Cake/View/View.php, line 418
include - APP/View/Articles/view.ctp, line 391
View::_evaluate() - CORE/Cake/View/View.php, line 971
View::_render() - CORE/Cake/View/View.php, line 933
View::render() - CORE/Cake/View/View.php, line 473
Controller::render() - CORE/Cake/Controller/Controller.php, line 968
Dispatcher::_invoke() - CORE/Cake/Routing/Dispatcher.php, line 200
Dispatcher::dispatch() - CORE/Cake/Routing/Dispatcher.php, line 167
[main] - APP/webroot/index.php, line 117
file not found!
Notice (8): Undefined variable: file [APP/View/Elements/side_bar.ctp, line 133]
$viewFile = '/var/www/html/newbusinessage.com/app/View/Elements/side_bar.ctp'
$dataForView = array(
'article' => array(
'Article' => array(
'id' => '14745',
'article_category_id' => '1',
'title' => 'Trade Deficit Increases to Rs 880 Billion',
'sub_title' => '',
'summary' => 'February 10: Nepal’s trade deficit increased by 46.6 percent in the first six months of the current fiscal year to Rs 880.49 billion.',
'content' => '<p><span style="font-size:11pt"><span style="font-family:Calibri,"sans-serif""><span style="font-size:14.0pt">February 10: Nepal’s trade deficit increased by 46.6 percent in the first six months of the current fiscal year to Rs 880.49 billion. According to the Nepal Rastra Bank, the total trade deficit had contracted 5.8 percent in the corresponding period of the previous year. </span></span></span></p>
<p><span style="font-size:11pt"><span style="font-family:Calibri,"sans-serif""><span style="font-size:14.0pt">The Current Macroeconomic and Financial Situation Report unveiled by the central bank on Wednesday states that the export-import ratio increased to 11.9 percent in the review period from 9.2 percent in the corresponding period of the previous year. </span></span></span></p>
<p><span style="font-size:11pt"><span style="font-family:Calibri,"sans-serif""><span style="font-size:14.0pt">During the six months of FY 2021/22, merchandise exports increased 95.5 percent to Rs 118.85 billion compared to an increase of 6.1 percent in the same period of the previous year. </span></span></span></p>
<p><span style="font-size:11pt"><span style="font-family:Calibri,"sans-serif""><span style="font-size:14.0pt">Destination-wise, exports to India and other countries increased 121.8 percent and 30.2 respectively whereas exports to China decreased 10.2 percent. </span></span></span></p>
<p><span style="font-size:11pt"><span style="font-family:Calibri,"sans-serif""><span style="font-size:14.0pt">Exports of palm oil, soybean oil, oil cakes, juice, woolen carpets, among others, increased whereas exports of cardamom, tea, herbs, zinc sheet, wire, among others, decreased in the review period, the report states.</span></span></span></p>
<p><span style="font-size:11pt"><span style="font-family:Calibri,"sans-serif""><span style="font-size:14.0pt">Similarly, merchandise imports during the six months of FY 2021/22 increased 51.1 percent to Rs 999.34 billion against a decrease of 4.8 percent a year ago. Destination-wise, imports from India, China and other countries increased 37.5 percent, 51.5 percent, and 98.2 percent respectively. </span></span></span></p>
<p><span style="font-size:11pt"><span style="font-family:Calibri,"sans-serif""><span style="font-size:14.0pt">According to the NRB report, imports of petroleum products, medicine, crude palm oil, transport equipment, vehicle and other parts, crude soybean oil, among others, increased whereas imports of MS billet, cement, pulses, molasses sugar, insecticides, among others, decreased in the review period. </span></span></span></p>
<p><span style="font-size:11pt"><span style="font-family:Calibri,"sans-serif""><span style="font-size:14.0pt">Based on customs points, exports from Kanchanpur, Mechi, and Nepalgunj customs offices decreased whereas exports from all the other major customs points increased in the review period. On the import side, imports from all the major customs points increased in the review period. </span></span></span></p>
<p> </p>
<p> </p>
<p><span style="font-size:11pt"><span style="font-family:Calibri,"sans-serif""><span style="font-size:14.0pt">During the six months of FY 2021/22, merchandise imports from India by paying convertible foreign currency amounted Rs 110.91 billion. Such amount was Rs 83.01 billion in the same period of the previous year. </span></span></span></p>
<p><span style="font-size:11pt"><span style="font-family:Calibri,"sans-serif""><span style="font-size:14.0pt">As per the Broad Economic Categories (BEC), the intermediate and final consumption goods accounted for 47.8 percent and 52.2 percent of the total exports respectively, whereas the ratio of capital goods in total exports remained negligible at 0.02 percent in the review period.</span></span></span></p>
<p><span style="font-size:11pt"><span style="font-family:Calibri,"sans-serif""><span style="font-size:14.0pt">In the same period of the previous year, the ratio of intermediate, capital and final consumption goods remained 31.9 percent, 0.6 percent and 67.5 percent of total exports respectively. </span></span></span></p>
<p><span style="font-size:11pt"><span style="font-family:Calibri,"sans-serif""><span style="font-size:14.0pt">On the imports side, the share of intermediate goods remained 53.7 percent, capital goods 10.9 percent and final consumption goods 35.4 percent in the review period. Such ratios were 52.6 percent, 12.0 percent and 35.4 percent respectively in the same period of the previous year, the report stated.</span></span></span></p>
',
'published' => true,
'created' => '2022-02-10',
'modified' => '2022-02-10',
'keywords' => '',
'description' => '',
'sortorder' => '14488',
'image' => '20220210025613_Trade.jpg',
'article_date' => '2022-02-10 14:55:28',
'homepage' => false,
'breaking_news' => false,
'main_news' => true,
'in_scroller' => null,
'user_id' => '34'
),
'ArticleCategory' => array(
'id' => '1',
'name' => 'NEWS',
'parentOf' => '0',
'published' => true,
'registered' => '2015-07-20 00:00:00',
'sortorder' => '158',
'del_flag' => '0',
'homepage' => true,
'display_in_menu' => true,
'user_id' => '1',
'created' => '0000-00-00 00:00:00',
'modified' => '2018-11-22 11:58:49'
),
'User' => array(
'password' => '*****',
'id' => '34',
'user_detail_id' => '1',
'group_id' => '1',
'username' => 'neeraj.roy@newbusinessage.com',
'name' => null,
'email' => 'neeraj.roy@newbusinessage.com',
'address' => null,
'gender' => null,
'access' => '1',
'phone' => null,
'access_type' => null,
'activated' => true,
'sortorder' => null,
'published' => null,
'created' => '2020-07-19 16:40:23',
'last_login' => '2024-08-13 13:55:06',
'ip' => '172.69.41.137'
),
'ArticleComment' => array(),
'ArticleFeature' => array(),
'ArticleHasAuthor' => array(),
'ArticleHasTag' => array(),
'ArticleView' => array(
(int) 0 => array(
[maximum depth reached]
)
),
'Slider' => array()
),
'current_user' => null,
'logged_in' => false
)
$article = array(
'Article' => array(
'id' => '14745',
'article_category_id' => '1',
'title' => 'Trade Deficit Increases to Rs 880 Billion',
'sub_title' => '',
'summary' => 'February 10: Nepal’s trade deficit increased by 46.6 percent in the first six months of the current fiscal year to Rs 880.49 billion.',
'content' => '<p><span style="font-size:11pt"><span style="font-family:Calibri,"sans-serif""><span style="font-size:14.0pt">February 10: Nepal’s trade deficit increased by 46.6 percent in the first six months of the current fiscal year to Rs 880.49 billion. According to the Nepal Rastra Bank, the total trade deficit had contracted 5.8 percent in the corresponding period of the previous year. </span></span></span></p>
<p><span style="font-size:11pt"><span style="font-family:Calibri,"sans-serif""><span style="font-size:14.0pt">The Current Macroeconomic and Financial Situation Report unveiled by the central bank on Wednesday states that the export-import ratio increased to 11.9 percent in the review period from 9.2 percent in the corresponding period of the previous year. </span></span></span></p>
<p><span style="font-size:11pt"><span style="font-family:Calibri,"sans-serif""><span style="font-size:14.0pt">During the six months of FY 2021/22, merchandise exports increased 95.5 percent to Rs 118.85 billion compared to an increase of 6.1 percent in the same period of the previous year. </span></span></span></p>
<p><span style="font-size:11pt"><span style="font-family:Calibri,"sans-serif""><span style="font-size:14.0pt">Destination-wise, exports to India and other countries increased 121.8 percent and 30.2 respectively whereas exports to China decreased 10.2 percent. </span></span></span></p>
<p><span style="font-size:11pt"><span style="font-family:Calibri,"sans-serif""><span style="font-size:14.0pt">Exports of palm oil, soybean oil, oil cakes, juice, woolen carpets, among others, increased whereas exports of cardamom, tea, herbs, zinc sheet, wire, among others, decreased in the review period, the report states.</span></span></span></p>
<p><span style="font-size:11pt"><span style="font-family:Calibri,"sans-serif""><span style="font-size:14.0pt">Similarly, merchandise imports during the six months of FY 2021/22 increased 51.1 percent to Rs 999.34 billion against a decrease of 4.8 percent a year ago. Destination-wise, imports from India, China and other countries increased 37.5 percent, 51.5 percent, and 98.2 percent respectively. </span></span></span></p>
<p><span style="font-size:11pt"><span style="font-family:Calibri,"sans-serif""><span style="font-size:14.0pt">According to the NRB report, imports of petroleum products, medicine, crude palm oil, transport equipment, vehicle and other parts, crude soybean oil, among others, increased whereas imports of MS billet, cement, pulses, molasses sugar, insecticides, among others, decreased in the review period. </span></span></span></p>
<p><span style="font-size:11pt"><span style="font-family:Calibri,"sans-serif""><span style="font-size:14.0pt">Based on customs points, exports from Kanchanpur, Mechi, and Nepalgunj customs offices decreased whereas exports from all the other major customs points increased in the review period. On the import side, imports from all the major customs points increased in the review period. </span></span></span></p>
<p> </p>
<p> </p>
<p><span style="font-size:11pt"><span style="font-family:Calibri,"sans-serif""><span style="font-size:14.0pt">During the six months of FY 2021/22, merchandise imports from India by paying convertible foreign currency amounted Rs 110.91 billion. Such amount was Rs 83.01 billion in the same period of the previous year. </span></span></span></p>
<p><span style="font-size:11pt"><span style="font-family:Calibri,"sans-serif""><span style="font-size:14.0pt">As per the Broad Economic Categories (BEC), the intermediate and final consumption goods accounted for 47.8 percent and 52.2 percent of the total exports respectively, whereas the ratio of capital goods in total exports remained negligible at 0.02 percent in the review period.</span></span></span></p>
<p><span style="font-size:11pt"><span style="font-family:Calibri,"sans-serif""><span style="font-size:14.0pt">In the same period of the previous year, the ratio of intermediate, capital and final consumption goods remained 31.9 percent, 0.6 percent and 67.5 percent of total exports respectively. </span></span></span></p>
<p><span style="font-size:11pt"><span style="font-family:Calibri,"sans-serif""><span style="font-size:14.0pt">On the imports side, the share of intermediate goods remained 53.7 percent, capital goods 10.9 percent and final consumption goods 35.4 percent in the review period. Such ratios were 52.6 percent, 12.0 percent and 35.4 percent respectively in the same period of the previous year, the report stated.</span></span></span></p>
',
'published' => true,
'created' => '2022-02-10',
'modified' => '2022-02-10',
'keywords' => '',
'description' => '',
'sortorder' => '14488',
'image' => '20220210025613_Trade.jpg',
'article_date' => '2022-02-10 14:55:28',
'homepage' => false,
'breaking_news' => false,
'main_news' => true,
'in_scroller' => null,
'user_id' => '34'
),
'ArticleCategory' => array(
'id' => '1',
'name' => 'NEWS',
'parentOf' => '0',
'published' => true,
'registered' => '2015-07-20 00:00:00',
'sortorder' => '158',
'del_flag' => '0',
'homepage' => true,
'display_in_menu' => true,
'user_id' => '1',
'created' => '0000-00-00 00:00:00',
'modified' => '2018-11-22 11:58:49'
),
'User' => array(
'password' => '*****',
'id' => '34',
'user_detail_id' => '1',
'group_id' => '1',
'username' => 'neeraj.roy@newbusinessage.com',
'name' => null,
'email' => 'neeraj.roy@newbusinessage.com',
'address' => null,
'gender' => null,
'access' => '1',
'phone' => null,
'access_type' => null,
'activated' => true,
'sortorder' => null,
'published' => null,
'created' => '2020-07-19 16:40:23',
'last_login' => '2024-08-13 13:55:06',
'ip' => '172.69.41.137'
),
'ArticleComment' => array(),
'ArticleFeature' => array(),
'ArticleHasAuthor' => array(),
'ArticleHasTag' => array(),
'ArticleView' => array(
(int) 0 => array(
'article_id' => '14745',
'hit' => '932'
)
),
'Slider' => array()
)
$current_user = null
$logged_in = false
$xml = false
include - APP/View/Elements/side_bar.ctp, line 133
View::_evaluate() - CORE/Cake/View/View.php, line 971
View::_render() - CORE/Cake/View/View.php, line 933
View::_renderElement() - CORE/Cake/View/View.php, line 1224
View::element() - CORE/Cake/View/View.php, line 418
include - APP/View/Articles/view.ctp, line 391
View::_evaluate() - CORE/Cake/View/View.php, line 971
View::_render() - CORE/Cake/View/View.php, line 933
View::render() - CORE/Cake/View/View.php, line 473
Controller::render() - CORE/Cake/Controller/Controller.php, line 968
Dispatcher::_invoke() - CORE/Cake/Routing/Dispatcher.php, line 200
Dispatcher::dispatch() - CORE/Cake/Routing/Dispatcher.php, line 167
[main] - APP/webroot/index.php, line 117
Warning (2): simplexml_load_file() [<a href='http://php.net/function.simplexml-load-file'>function.simplexml-load-file</a>]: I/O warning : failed to load external entity "" [APP/View/Elements/side_bar.ctp, line 133]
$viewFile = '/var/www/html/newbusinessage.com/app/View/Elements/side_bar.ctp'
$dataForView = array(
'article' => array(
'Article' => array(
'id' => '14745',
'article_category_id' => '1',
'title' => 'Trade Deficit Increases to Rs 880 Billion',
'sub_title' => '',
'summary' => 'February 10: Nepal’s trade deficit increased by 46.6 percent in the first six months of the current fiscal year to Rs 880.49 billion.',
'content' => '<p><span style="font-size:11pt"><span style="font-family:Calibri,"sans-serif""><span style="font-size:14.0pt">February 10: Nepal’s trade deficit increased by 46.6 percent in the first six months of the current fiscal year to Rs 880.49 billion. According to the Nepal Rastra Bank, the total trade deficit had contracted 5.8 percent in the corresponding period of the previous year. </span></span></span></p>
<p><span style="font-size:11pt"><span style="font-family:Calibri,"sans-serif""><span style="font-size:14.0pt">The Current Macroeconomic and Financial Situation Report unveiled by the central bank on Wednesday states that the export-import ratio increased to 11.9 percent in the review period from 9.2 percent in the corresponding period of the previous year. </span></span></span></p>
<p><span style="font-size:11pt"><span style="font-family:Calibri,"sans-serif""><span style="font-size:14.0pt">During the six months of FY 2021/22, merchandise exports increased 95.5 percent to Rs 118.85 billion compared to an increase of 6.1 percent in the same period of the previous year. </span></span></span></p>
<p><span style="font-size:11pt"><span style="font-family:Calibri,"sans-serif""><span style="font-size:14.0pt">Destination-wise, exports to India and other countries increased 121.8 percent and 30.2 respectively whereas exports to China decreased 10.2 percent. </span></span></span></p>
<p><span style="font-size:11pt"><span style="font-family:Calibri,"sans-serif""><span style="font-size:14.0pt">Exports of palm oil, soybean oil, oil cakes, juice, woolen carpets, among others, increased whereas exports of cardamom, tea, herbs, zinc sheet, wire, among others, decreased in the review period, the report states.</span></span></span></p>
<p><span style="font-size:11pt"><span style="font-family:Calibri,"sans-serif""><span style="font-size:14.0pt">Similarly, merchandise imports during the six months of FY 2021/22 increased 51.1 percent to Rs 999.34 billion against a decrease of 4.8 percent a year ago. Destination-wise, imports from India, China and other countries increased 37.5 percent, 51.5 percent, and 98.2 percent respectively. </span></span></span></p>
<p><span style="font-size:11pt"><span style="font-family:Calibri,"sans-serif""><span style="font-size:14.0pt">According to the NRB report, imports of petroleum products, medicine, crude palm oil, transport equipment, vehicle and other parts, crude soybean oil, among others, increased whereas imports of MS billet, cement, pulses, molasses sugar, insecticides, among others, decreased in the review period. </span></span></span></p>
<p><span style="font-size:11pt"><span style="font-family:Calibri,"sans-serif""><span style="font-size:14.0pt">Based on customs points, exports from Kanchanpur, Mechi, and Nepalgunj customs offices decreased whereas exports from all the other major customs points increased in the review period. On the import side, imports from all the major customs points increased in the review period. </span></span></span></p>
<p> </p>
<p> </p>
<p><span style="font-size:11pt"><span style="font-family:Calibri,"sans-serif""><span style="font-size:14.0pt">During the six months of FY 2021/22, merchandise imports from India by paying convertible foreign currency amounted Rs 110.91 billion. Such amount was Rs 83.01 billion in the same period of the previous year. </span></span></span></p>
<p><span style="font-size:11pt"><span style="font-family:Calibri,"sans-serif""><span style="font-size:14.0pt">As per the Broad Economic Categories (BEC), the intermediate and final consumption goods accounted for 47.8 percent and 52.2 percent of the total exports respectively, whereas the ratio of capital goods in total exports remained negligible at 0.02 percent in the review period.</span></span></span></p>
<p><span style="font-size:11pt"><span style="font-family:Calibri,"sans-serif""><span style="font-size:14.0pt">In the same period of the previous year, the ratio of intermediate, capital and final consumption goods remained 31.9 percent, 0.6 percent and 67.5 percent of total exports respectively. </span></span></span></p>
<p><span style="font-size:11pt"><span style="font-family:Calibri,"sans-serif""><span style="font-size:14.0pt">On the imports side, the share of intermediate goods remained 53.7 percent, capital goods 10.9 percent and final consumption goods 35.4 percent in the review period. Such ratios were 52.6 percent, 12.0 percent and 35.4 percent respectively in the same period of the previous year, the report stated.</span></span></span></p>
',
'published' => true,
'created' => '2022-02-10',
'modified' => '2022-02-10',
'keywords' => '',
'description' => '',
'sortorder' => '14488',
'image' => '20220210025613_Trade.jpg',
'article_date' => '2022-02-10 14:55:28',
'homepage' => false,
'breaking_news' => false,
'main_news' => true,
'in_scroller' => null,
'user_id' => '34'
),
'ArticleCategory' => array(
'id' => '1',
'name' => 'NEWS',
'parentOf' => '0',
'published' => true,
'registered' => '2015-07-20 00:00:00',
'sortorder' => '158',
'del_flag' => '0',
'homepage' => true,
'display_in_menu' => true,
'user_id' => '1',
'created' => '0000-00-00 00:00:00',
'modified' => '2018-11-22 11:58:49'
),
'User' => array(
'password' => '*****',
'id' => '34',
'user_detail_id' => '1',
'group_id' => '1',
'username' => 'neeraj.roy@newbusinessage.com',
'name' => null,
'email' => 'neeraj.roy@newbusinessage.com',
'address' => null,
'gender' => null,
'access' => '1',
'phone' => null,
'access_type' => null,
'activated' => true,
'sortorder' => null,
'published' => null,
'created' => '2020-07-19 16:40:23',
'last_login' => '2024-08-13 13:55:06',
'ip' => '172.69.41.137'
),
'ArticleComment' => array(),
'ArticleFeature' => array(),
'ArticleHasAuthor' => array(),
'ArticleHasTag' => array(),
'ArticleView' => array(
(int) 0 => array(
[maximum depth reached]
)
),
'Slider' => array()
),
'current_user' => null,
'logged_in' => false
)
$article = array(
'Article' => array(
'id' => '14745',
'article_category_id' => '1',
'title' => 'Trade Deficit Increases to Rs 880 Billion',
'sub_title' => '',
'summary' => 'February 10: Nepal’s trade deficit increased by 46.6 percent in the first six months of the current fiscal year to Rs 880.49 billion.',
'content' => '<p><span style="font-size:11pt"><span style="font-family:Calibri,"sans-serif""><span style="font-size:14.0pt">February 10: Nepal’s trade deficit increased by 46.6 percent in the first six months of the current fiscal year to Rs 880.49 billion. According to the Nepal Rastra Bank, the total trade deficit had contracted 5.8 percent in the corresponding period of the previous year. </span></span></span></p>
<p><span style="font-size:11pt"><span style="font-family:Calibri,"sans-serif""><span style="font-size:14.0pt">The Current Macroeconomic and Financial Situation Report unveiled by the central bank on Wednesday states that the export-import ratio increased to 11.9 percent in the review period from 9.2 percent in the corresponding period of the previous year. </span></span></span></p>
<p><span style="font-size:11pt"><span style="font-family:Calibri,"sans-serif""><span style="font-size:14.0pt">During the six months of FY 2021/22, merchandise exports increased 95.5 percent to Rs 118.85 billion compared to an increase of 6.1 percent in the same period of the previous year. </span></span></span></p>
<p><span style="font-size:11pt"><span style="font-family:Calibri,"sans-serif""><span style="font-size:14.0pt">Destination-wise, exports to India and other countries increased 121.8 percent and 30.2 respectively whereas exports to China decreased 10.2 percent. </span></span></span></p>
<p><span style="font-size:11pt"><span style="font-family:Calibri,"sans-serif""><span style="font-size:14.0pt">Exports of palm oil, soybean oil, oil cakes, juice, woolen carpets, among others, increased whereas exports of cardamom, tea, herbs, zinc sheet, wire, among others, decreased in the review period, the report states.</span></span></span></p>
<p><span style="font-size:11pt"><span style="font-family:Calibri,"sans-serif""><span style="font-size:14.0pt">Similarly, merchandise imports during the six months of FY 2021/22 increased 51.1 percent to Rs 999.34 billion against a decrease of 4.8 percent a year ago. Destination-wise, imports from India, China and other countries increased 37.5 percent, 51.5 percent, and 98.2 percent respectively. </span></span></span></p>
<p><span style="font-size:11pt"><span style="font-family:Calibri,"sans-serif""><span style="font-size:14.0pt">According to the NRB report, imports of petroleum products, medicine, crude palm oil, transport equipment, vehicle and other parts, crude soybean oil, among others, increased whereas imports of MS billet, cement, pulses, molasses sugar, insecticides, among others, decreased in the review period. </span></span></span></p>
<p><span style="font-size:11pt"><span style="font-family:Calibri,"sans-serif""><span style="font-size:14.0pt">Based on customs points, exports from Kanchanpur, Mechi, and Nepalgunj customs offices decreased whereas exports from all the other major customs points increased in the review period. On the import side, imports from all the major customs points increased in the review period. </span></span></span></p>
<p> </p>
<p> </p>
<p><span style="font-size:11pt"><span style="font-family:Calibri,"sans-serif""><span style="font-size:14.0pt">During the six months of FY 2021/22, merchandise imports from India by paying convertible foreign currency amounted Rs 110.91 billion. Such amount was Rs 83.01 billion in the same period of the previous year. </span></span></span></p>
<p><span style="font-size:11pt"><span style="font-family:Calibri,"sans-serif""><span style="font-size:14.0pt">As per the Broad Economic Categories (BEC), the intermediate and final consumption goods accounted for 47.8 percent and 52.2 percent of the total exports respectively, whereas the ratio of capital goods in total exports remained negligible at 0.02 percent in the review period.</span></span></span></p>
<p><span style="font-size:11pt"><span style="font-family:Calibri,"sans-serif""><span style="font-size:14.0pt">In the same period of the previous year, the ratio of intermediate, capital and final consumption goods remained 31.9 percent, 0.6 percent and 67.5 percent of total exports respectively. </span></span></span></p>
<p><span style="font-size:11pt"><span style="font-family:Calibri,"sans-serif""><span style="font-size:14.0pt">On the imports side, the share of intermediate goods remained 53.7 percent, capital goods 10.9 percent and final consumption goods 35.4 percent in the review period. Such ratios were 52.6 percent, 12.0 percent and 35.4 percent respectively in the same period of the previous year, the report stated.</span></span></span></p>
',
'published' => true,
'created' => '2022-02-10',
'modified' => '2022-02-10',
'keywords' => '',
'description' => '',
'sortorder' => '14488',
'image' => '20220210025613_Trade.jpg',
'article_date' => '2022-02-10 14:55:28',
'homepage' => false,
'breaking_news' => false,
'main_news' => true,
'in_scroller' => null,
'user_id' => '34'
),
'ArticleCategory' => array(
'id' => '1',
'name' => 'NEWS',
'parentOf' => '0',
'published' => true,
'registered' => '2015-07-20 00:00:00',
'sortorder' => '158',
'del_flag' => '0',
'homepage' => true,
'display_in_menu' => true,
'user_id' => '1',
'created' => '0000-00-00 00:00:00',
'modified' => '2018-11-22 11:58:49'
),
'User' => array(
'password' => '*****',
'id' => '34',
'user_detail_id' => '1',
'group_id' => '1',
'username' => 'neeraj.roy@newbusinessage.com',
'name' => null,
'email' => 'neeraj.roy@newbusinessage.com',
'address' => null,
'gender' => null,
'access' => '1',
'phone' => null,
'access_type' => null,
'activated' => true,
'sortorder' => null,
'published' => null,
'created' => '2020-07-19 16:40:23',
'last_login' => '2024-08-13 13:55:06',
'ip' => '172.69.41.137'
),
'ArticleComment' => array(),
'ArticleFeature' => array(),
'ArticleHasAuthor' => array(),
'ArticleHasTag' => array(),
'ArticleView' => array(
(int) 0 => array(
'article_id' => '14745',
'hit' => '932'
)
),
'Slider' => array()
)
$current_user = null
$logged_in = false
$xml = false
simplexml_load_file - [internal], line ??
include - APP/View/Elements/side_bar.ctp, line 133
View::_evaluate() - CORE/Cake/View/View.php, line 971
View::_render() - CORE/Cake/View/View.php, line 933
View::_renderElement() - CORE/Cake/View/View.php, line 1224
View::element() - CORE/Cake/View/View.php, line 418
include - APP/View/Articles/view.ctp, line 391
View::_evaluate() - CORE/Cake/View/View.php, line 971
View::_render() - CORE/Cake/View/View.php, line 933
View::render() - CORE/Cake/View/View.php, line 473
Controller::render() - CORE/Cake/Controller/Controller.php, line 968
Dispatcher::_invoke() - CORE/Cake/Routing/Dispatcher.php, line 200
Dispatcher::dispatch() - CORE/Cake/Routing/Dispatcher.php, line 167
[main] - APP/webroot/index.php, line 117