$user = $this->Session->read('Auth.User');
//find the group of logged user
$groupId = $user['Group']['id'];
$viewFile = '/var/www/html/newbusinessage.com/app/View/Articles/view.ctp'
$dataForView = array(
'article' => array(
'Article' => array(
'id' => '10220',
'article_category_id' => '1',
'title' => 'Market Watch of March 7',
'sub_title' => '',
'summary' => 'The CMP of 23rd Falgun is 1,127.77 which are above the daily pivot of 1,122.41 as well as above the weekly pivot 1,118.16.',
'content' => '<p>
<strong>Current market price (CMP): </strong><strong>1,127.77</strong></p>
<p>
</p>
<p>
<strong>OHLC update of this week: </strong></p>
<p>
O: 1105.53</p>
<p>
H: 1127.77</p>
<p>
L: 1098.95</p>
<p>
C: 1127.77</p>
<p>
</p>
<p>
<strong>Pivot table for next week (26th to 30th falgun): </strong></p>
<table border="1" cellpadding="0" cellspacing="0">
<tbody>
<tr>
<td style="width:91px;">
<p align="center">
<strong>S3</strong></p>
</td>
<td style="width:91px;">
<p align="center">
<strong>S2</strong></p>
</td>
<td style="width:91px;">
<p align="center">
<strong>S1</strong></p>
</td>
<td style="width:91px;">
<p align="center">
<strong>Pivot</strong></p>
</td>
<td style="width:91px;">
<p align="center">
<strong>R1</strong></p>
</td>
<td style="width:91px;">
<p align="center">
<strong>R2</strong></p>
</td>
<td style="width:91px;">
<p align="center">
<strong>R3</strong></p>
</td>
</tr>
<tr>
<td style="width:91px;">
<p align="center">
1,079.74</p>
</td>
<td style="width:91px;">
<p align="center">
1,089.34</p>
</td>
<td style="width:91px;">
<p align="center">
1,108.56</p>
</td>
<td style="width:91px;">
<p align="center">
1,118.16</p>
</td>
<td style="width:91px;">
<p align="center">
1,137.38</p>
</td>
<td style="width:91px;">
<p align="center">
1,146.98</p>
</td>
<td style="width:91px;">
<p align="center">
1,166.2</p>
</td>
</tr>
</tbody>
</table>
<p align="center">
</p>
<p>
<strong>Pivot for this month:</strong></p>
<table align="left" border="1" cellpadding="0" cellspacing="0" style="width:658px;" width="658">
<tbody>
<tr>
<td style="width:94px;height:22px;">
<p style="text-align: center;">
<strong>S3</strong></p>
</td>
<td style="width:94px;height:22px;">
<p style="text-align: center;">
<strong>S2</strong></p>
</td>
<td style="width:94px;height:22px;">
<p style="text-align: center;">
<strong>S1</strong></p>
</td>
<td style="width:88px;height:22px;">
<p style="text-align: center;">
<strong>Pivot</strong></p>
</td>
<td style="width:96px;height:22px;">
<p style="text-align: center;">
<strong>R1</strong></p>
</td>
<td style="width:96px;height:22px;">
<p style="text-align: center;">
<strong>R2</strong></p>
</td>
<td style="width:96px;height:22px;">
<p style="text-align: center;">
<strong>R3</strong></p>
</td>
</tr>
<tr>
<td style="width:94px;height:22px;">
<p style="text-align: center;">
<strong>1025.74 </strong></p>
</td>
<td style="width:94px;height:22px;">
<p style="text-align: center;">
<strong>1075.08 </strong></p>
</td>
<td style="width:94px;height:22px;">
<p style="text-align: center;">
<strong>1101.64 </strong></p>
</td>
<td style="width:88px;height:22px;">
<p style="text-align: center;">
<strong>1150.98 </strong></p>
</td>
<td style="width:96px;height:22px;">
<p style="text-align: center;">
<strong>1177.54 </strong></p>
</td>
<td style="width:96px;height:22px;">
<p style="text-align: center;">
<strong>1226.88 </strong></p>
</td>
<td style="width:96px;height:22px;">
<p style="text-align: center;">
<strong>1253.44 </strong></p>
</td>
</tr>
</tbody>
</table>
<p style="text-align: center;">
</p>
<p style="text-align: center;">
</p>
<p style="text-align: center;">
</p>
<p>
<strong>Volume:</strong></p>
<p>
This week: 96.37 crores</p>
<p>
Last week: 79.75 crores</p>
<p align="center">
</p>
<p>
<strong>Projected range for next week: 1,113.36 to 1,142.18</strong></p>
<p>
<strong>OHLC update of 23<sup>rd</sup> Falgun:</strong></p>
<p>
O: 1111.76</p>
<p>
H: 1127.77</p>
<p>
L: 1111.70</p>
<p>
C: 1127.77</p>
<p>
<strong>Pivot table for 26<sup>th</sup> Falgun: </strong></p>
<table border="1" cellpadding="0" cellspacing="0">
<tbody>
<tr>
<td style="width:91px;">
<p align="center">
<strong>S3</strong></p>
</td>
<td style="width:91px;">
<p align="center">
<strong>S2</strong></p>
</td>
<td style="width:91px;">
<p align="center">
<strong>S1</strong></p>
</td>
<td style="width:91px;">
<p align="center">
<strong>Pivot</strong></p>
</td>
<td style="width:91px;">
<p align="center">
<strong>R1</strong></p>
</td>
<td style="width:91px;">
<p align="center">
<strong>R2</strong></p>
</td>
<td style="width:91px;">
<p align="center">
<strong>R3</strong></p>
</td>
</tr>
<tr>
<td style="width:91px;">
<p align="center">
1,100.99</p>
</td>
<td style="width:91px;">
<p align="center">
1,106.34</p>
</td>
<td style="width:91px;">
<p align="center">
1,117.06</p>
</td>
<td style="width:91px;">
<p align="center">
1,122.41</p>
</td>
<td style="width:91px;">
<p align="center">
1,133.13</p>
</td>
<td style="width:91px;">
<p align="center">
1,138.48</p>
</td>
<td style="width:91px;">
<p align="center">
1,149.2</p>
</td>
</tr>
</tbody>
</table>
<p align="center">
</p>
<p>
<strong>Turnover:</strong></p>
<p>
This week (19<sup>th</sup> to 23<sup>rd</sup> Falgun): 96.37 crores</p>
<p>
Last week (12<sup>th</sup> to 16<sup>th</sup> Falgun): 79.75 crores</p>
<p>
23<sup>rd</sup> Falgun: 29.39 crores</p>
<p>
</p>
<p>
<strong>Outlook: </strong></p>
<p>
The CMP of 23<sup>rd</sup> Falgun is 1,127.77 which are above the daily pivot of 1,122.41 as well as above the weekly pivot 1,118.16.</p>
<p>
</p>
<p>
<strong>Sub indices market information: </strong></p>
<ul>
<li>
- Life insurance has increased by 159.32 points in index value.</li>
<li>
- Non life insurance has increased by 105.24 points in index value.</li>
<li>
- Banking has increased by 13.92 points in index value.</li>
</ul>
<p>
</p>
<p>
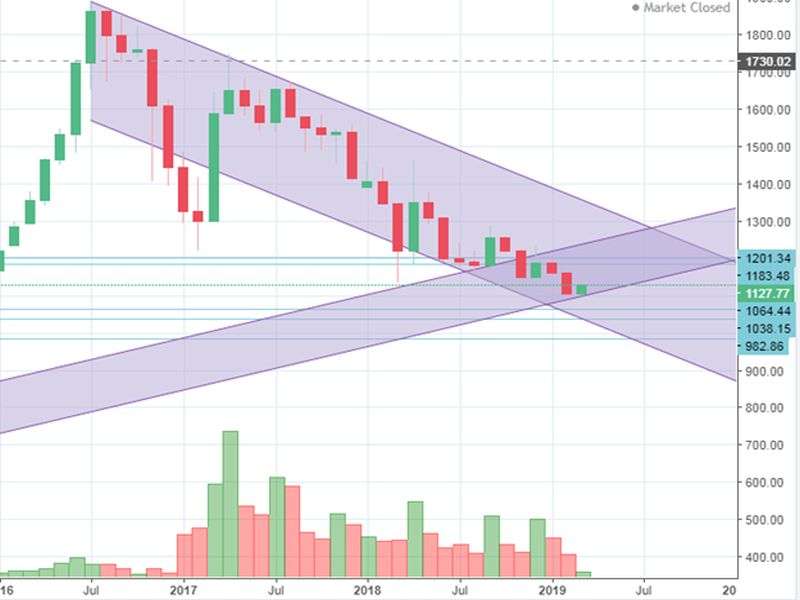
<img alt="" src="/app/webroot/userfiles/images/Vacancies/march%208%20pic%201.jpg" style="width: 800px; height: 600px;" /></p>
<p>
<strong> Banking candle stick chart</strong></p>
<p style="margin-left:.25in;">
</p>
<p style="margin-left:.25in;">
<strong>The top 5 scrips of banking in turnover are: </strong></p>
<table border="1" cellpadding="0" cellspacing="0">
<tbody>
<tr>
<td style="width:174px;height:22px;">
<p>
<strong>Scrips</strong></p>
</td>
<td style="width:176px;height:22px;">
<p>
<strong>Turnover</strong></p>
</td>
<td style="width:174px;height:22px;">
<p>
<strong>LTP</strong></p>
</td>
</tr>
<tr>
<td style="width:174px;height:22px;">
<p>
NCCB</p>
</td>
<td style="width:176px;height:22px;">
<p>
NRS. 1.282 crores</p>
</td>
<td style="width:174px;height:22px;">
<p>
210</p>
</td>
</tr>
<tr>
<td style="width:174px;height:21px;">
<p>
PRVU</p>
</td>
<td style="width:176px;height:21px;">
<p>
NRS. 1.046 crores</p>
</td>
<td style="width:174px;height:21px;">
<p>
224</p>
</td>
</tr>
<tr>
<td style="width:174px;height:22px;">
<p>
NICA</p>
</td>
<td style="width:176px;height:22px;">
<p>
NRs. 1.035 crores</p>
</td>
<td style="width:174px;height:22px;">
<p>
391</p>
</td>
</tr>
<tr>
<td style="width:174px;height:22px;">
<p>
CBBL</p>
</td>
<td style="width:176px;height:22px;">
<p>
NRs. 0.772 crores</p>
</td>
<td style="width:174px;height:22px;">
<p>
886</p>
</td>
</tr>
<tr>
<td style="width:174px;height:22px;">
<p>
CIT</p>
</td>
<td style="width:176px;height:22px;">
<p>
NRs. 0754 crores</p>
</td>
<td style="width:174px;height:22px;">
<p>
2,563</p>
</td>
</tr>
</tbody>
</table>
<p>
<strong>Conclusion</strong></p>
<p>
It is said that the stock market progressions are always process of anomalous and adventure.</p>
<p>
Sometimes lousy movements, sometimes very disciplined and calculative and sometimes very wild with high motility behaviors.</p>
<p>
For past few weeks markets have shown choppy to down trend Trading courses.</p>
<p>
But this few weeks market has shown a recovery sign both in Index value and volume.</p>
<p>
If we look at past years same months (magh, falgun and chaitra). The market had shown a recovery but only for short time. The market has shown a recovery but only for short time. The difference is the market turnover used to be more than Rs. 100 crores per day during last couple of years, but this time market turnover has been as meager Rs. 20 crores per day in average for long periods. Still, If analysis is to be made on volume side, though with meager, rise market show a sign of recovery with mild reliability.</p>
<p>
</p>
<p>
The support and resistant's on the charts have been distinguished on the charts below.</p>
<p>
</p>
<p>
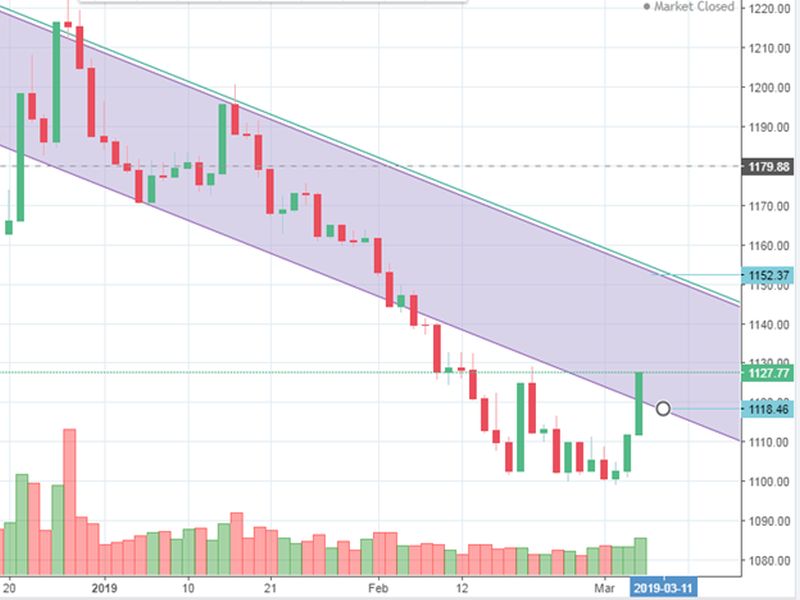
<img alt="" src="/app/webroot/userfiles/images/Vacancies/march%208%20pic%202.jpg" style="width: 800px; height: 600px;" /></p>
<p>
<strong> NEPSE monthly chart with multiple support and resistant</strong></p>
<p>
</p>
<p>
a) Bearish channel, Strong support at 1064- 1040.</p>
<p>
b) Bullish channel, Strong Resistant at 1183- 1204.</p>
<p>
</p>
<p>
</p>
<p>
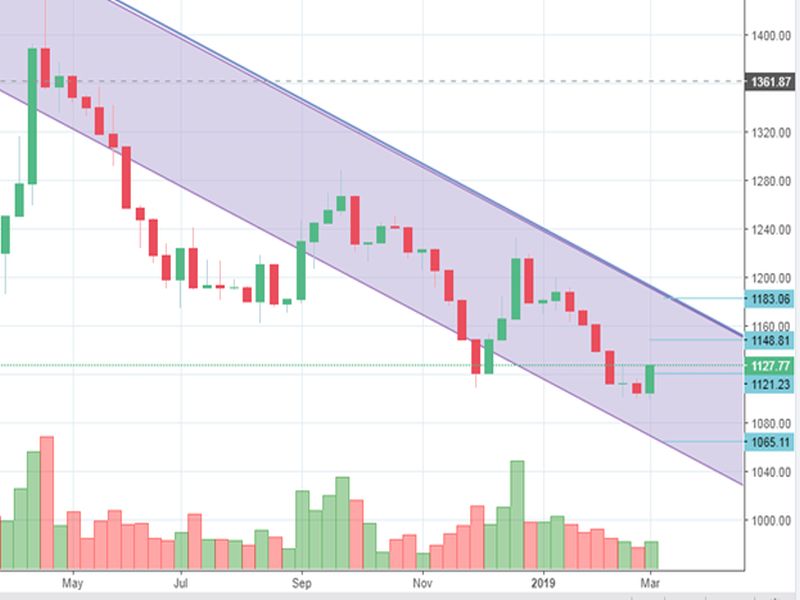
<img alt="" src="/app/webroot/userfiles/images/Vacancies/march%208%20pic%203.jpg" style="width: 800px; height: 600px;" /></p>
<p>
<strong> NEPSE weekly candle stick</strong></p>
<p>
a) Inside the bearish channel markets range for next few weeks are as:</p>
<p>
i) Current Market Price (CMP) = 1127.77</p>
<p>
ii) Support: Initial support = 1121.23</p>
<p>
Intermediary support =1098/1096</p>
<p>
Final support = 1065.11</p>
<p>
iii) Resistant: Initial resistant = 1148.81</p>
<p>
Final resistant = 1183.06</p>
<p>
b) Bullish engulfing candle stock pattern with mild reliability.</p>
<p>
</p>
<p>
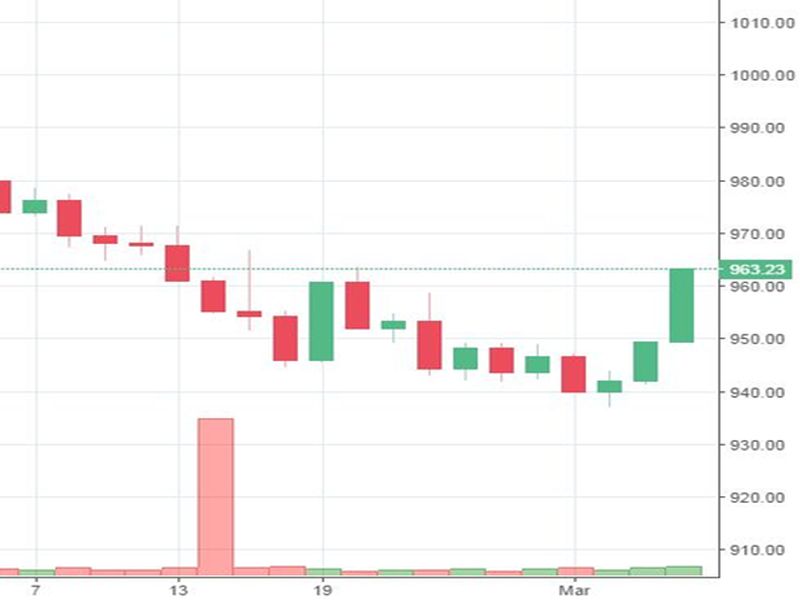
<img alt="" src="/app/webroot/userfiles/images/Vacancies/march%208%20pic%204.jpg" style="width: 800px; height: 600px;" /></p>
<p>
<strong>Nepse daily candle stick</strong></p>
<p>
</p>
<p>
a) The market has been seemed to increase in its volume and index too.</p>
<p>
b) Some may want to sell and some may want to buy the share.</p>
<p>
c) The most increased points among all was of life insurance.</p>
<p>
</p>
<p>
<strong> Fundamentals:</strong></p>
<p>
1) Next week falgun closing is ahead.</p>
<p>
2) Next month 3rd fiscal quarterly closing starts.</p>
<p>
a) If banks are provided with enough liquidity, the current bullish market would be approved for </p>
<p>
further price gain.</p>
<p>
b) In case the banks are not comfortable with enough liquidity, chaitra 2nd/ 3rd week may face a </p>
<p>
panic sell in market.</p>
<p>
c) Since third quarter is in verge to close, government and its agency seems claiming a robust fiscal</p>
<p>
growth amid various challenges.</p>
<p>
d) The most important factor is, if government is ready to spend the allocated budget in chaitra? or</p>
<p>
will it wait for next month.</p>
<p>
</p>
<p>
</p>
<p>
</p>
<p>
<strong> Happy trading……..!!!!!!!</strong></p>
<p>
</p>
<p>
</p>
',
'published' => true,
'created' => '2019-03-08',
'modified' => '2019-03-08',
'keywords' => '',
'description' => '',
'sortorder' => '9986',
'image' => '20190308062910_march 8 pic 2.jpg',
'article_date' => '2019-03-08 00:00:00',
'homepage' => true,
'breaking_news' => false,
'main_news' => false,
'in_scroller' => false,
'user_id' => '22'
),
'ArticleCategory' => array(
'id' => '1',
'name' => 'NEWS',
'parentOf' => '0',
'published' => true,
'registered' => '2015-07-20 00:00:00',
'sortorder' => '158',
'del_flag' => '0',
'homepage' => true,
'display_in_menu' => true,
'user_id' => '1',
'created' => '0000-00-00 00:00:00',
'modified' => '2018-11-22 11:58:49'
),
'User' => array(
'password' => '*****',
'id' => '22',
'user_detail_id' => '1',
'group_id' => '24',
'username' => 'kishor.bam@newbusinessage.com',
'name' => '',
'email' => 'kishor.bam@newbusinessage.com',
'address' => '',
'gender' => '',
'access' => '1',
'phone' => '',
'access_type' => '0',
'activated' => false,
'sortorder' => '0',
'published' => '0',
'created' => '2018-11-30 10:47:22',
'last_login' => '2019-06-09 10:32:40',
'ip' => '202.63.242.112'
),
'ArticleComment' => array(),
'ArticleFeature' => array(),
'ArticleHasAuthor' => array(),
'ArticleHasTag' => array(),
'ArticleView' => array(
(int) 0 => array(
[maximum depth reached]
)
),
'Slider' => array()
),
'current_user' => null,
'logged_in' => false
)
$article = array(
'Article' => array(
'id' => '10220',
'article_category_id' => '1',
'title' => 'Market Watch of March 7',
'sub_title' => '',
'summary' => 'The CMP of 23rd Falgun is 1,127.77 which are above the daily pivot of 1,122.41 as well as above the weekly pivot 1,118.16.',
'content' => '<p>
<strong>Current market price (CMP): </strong><strong>1,127.77</strong></p>
<p>
</p>
<p>
<strong>OHLC update of this week: </strong></p>
<p>
O: 1105.53</p>
<p>
H: 1127.77</p>
<p>
L: 1098.95</p>
<p>
C: 1127.77</p>
<p>
</p>
<p>
<strong>Pivot table for next week (26th to 30th falgun): </strong></p>
<table border="1" cellpadding="0" cellspacing="0">
<tbody>
<tr>
<td style="width:91px;">
<p align="center">
<strong>S3</strong></p>
</td>
<td style="width:91px;">
<p align="center">
<strong>S2</strong></p>
</td>
<td style="width:91px;">
<p align="center">
<strong>S1</strong></p>
</td>
<td style="width:91px;">
<p align="center">
<strong>Pivot</strong></p>
</td>
<td style="width:91px;">
<p align="center">
<strong>R1</strong></p>
</td>
<td style="width:91px;">
<p align="center">
<strong>R2</strong></p>
</td>
<td style="width:91px;">
<p align="center">
<strong>R3</strong></p>
</td>
</tr>
<tr>
<td style="width:91px;">
<p align="center">
1,079.74</p>
</td>
<td style="width:91px;">
<p align="center">
1,089.34</p>
</td>
<td style="width:91px;">
<p align="center">
1,108.56</p>
</td>
<td style="width:91px;">
<p align="center">
1,118.16</p>
</td>
<td style="width:91px;">
<p align="center">
1,137.38</p>
</td>
<td style="width:91px;">
<p align="center">
1,146.98</p>
</td>
<td style="width:91px;">
<p align="center">
1,166.2</p>
</td>
</tr>
</tbody>
</table>
<p align="center">
</p>
<p>
<strong>Pivot for this month:</strong></p>
<table align="left" border="1" cellpadding="0" cellspacing="0" style="width:658px;" width="658">
<tbody>
<tr>
<td style="width:94px;height:22px;">
<p style="text-align: center;">
<strong>S3</strong></p>
</td>
<td style="width:94px;height:22px;">
<p style="text-align: center;">
<strong>S2</strong></p>
</td>
<td style="width:94px;height:22px;">
<p style="text-align: center;">
<strong>S1</strong></p>
</td>
<td style="width:88px;height:22px;">
<p style="text-align: center;">
<strong>Pivot</strong></p>
</td>
<td style="width:96px;height:22px;">
<p style="text-align: center;">
<strong>R1</strong></p>
</td>
<td style="width:96px;height:22px;">
<p style="text-align: center;">
<strong>R2</strong></p>
</td>
<td style="width:96px;height:22px;">
<p style="text-align: center;">
<strong>R3</strong></p>
</td>
</tr>
<tr>
<td style="width:94px;height:22px;">
<p style="text-align: center;">
<strong>1025.74 </strong></p>
</td>
<td style="width:94px;height:22px;">
<p style="text-align: center;">
<strong>1075.08 </strong></p>
</td>
<td style="width:94px;height:22px;">
<p style="text-align: center;">
<strong>1101.64 </strong></p>
</td>
<td style="width:88px;height:22px;">
<p style="text-align: center;">
<strong>1150.98 </strong></p>
</td>
<td style="width:96px;height:22px;">
<p style="text-align: center;">
<strong>1177.54 </strong></p>
</td>
<td style="width:96px;height:22px;">
<p style="text-align: center;">
<strong>1226.88 </strong></p>
</td>
<td style="width:96px;height:22px;">
<p style="text-align: center;">
<strong>1253.44 </strong></p>
</td>
</tr>
</tbody>
</table>
<p style="text-align: center;">
</p>
<p style="text-align: center;">
</p>
<p style="text-align: center;">
</p>
<p>
<strong>Volume:</strong></p>
<p>
This week: 96.37 crores</p>
<p>
Last week: 79.75 crores</p>
<p align="center">
</p>
<p>
<strong>Projected range for next week: 1,113.36 to 1,142.18</strong></p>
<p>
<strong>OHLC update of 23<sup>rd</sup> Falgun:</strong></p>
<p>
O: 1111.76</p>
<p>
H: 1127.77</p>
<p>
L: 1111.70</p>
<p>
C: 1127.77</p>
<p>
<strong>Pivot table for 26<sup>th</sup> Falgun: </strong></p>
<table border="1" cellpadding="0" cellspacing="0">
<tbody>
<tr>
<td style="width:91px;">
<p align="center">
<strong>S3</strong></p>
</td>
<td style="width:91px;">
<p align="center">
<strong>S2</strong></p>
</td>
<td style="width:91px;">
<p align="center">
<strong>S1</strong></p>
</td>
<td style="width:91px;">
<p align="center">
<strong>Pivot</strong></p>
</td>
<td style="width:91px;">
<p align="center">
<strong>R1</strong></p>
</td>
<td style="width:91px;">
<p align="center">
<strong>R2</strong></p>
</td>
<td style="width:91px;">
<p align="center">
<strong>R3</strong></p>
</td>
</tr>
<tr>
<td style="width:91px;">
<p align="center">
1,100.99</p>
</td>
<td style="width:91px;">
<p align="center">
1,106.34</p>
</td>
<td style="width:91px;">
<p align="center">
1,117.06</p>
</td>
<td style="width:91px;">
<p align="center">
1,122.41</p>
</td>
<td style="width:91px;">
<p align="center">
1,133.13</p>
</td>
<td style="width:91px;">
<p align="center">
1,138.48</p>
</td>
<td style="width:91px;">
<p align="center">
1,149.2</p>
</td>
</tr>
</tbody>
</table>
<p align="center">
</p>
<p>
<strong>Turnover:</strong></p>
<p>
This week (19<sup>th</sup> to 23<sup>rd</sup> Falgun): 96.37 crores</p>
<p>
Last week (12<sup>th</sup> to 16<sup>th</sup> Falgun): 79.75 crores</p>
<p>
23<sup>rd</sup> Falgun: 29.39 crores</p>
<p>
</p>
<p>
<strong>Outlook: </strong></p>
<p>
The CMP of 23<sup>rd</sup> Falgun is 1,127.77 which are above the daily pivot of 1,122.41 as well as above the weekly pivot 1,118.16.</p>
<p>
</p>
<p>
<strong>Sub indices market information: </strong></p>
<ul>
<li>
- Life insurance has increased by 159.32 points in index value.</li>
<li>
- Non life insurance has increased by 105.24 points in index value.</li>
<li>
- Banking has increased by 13.92 points in index value.</li>
</ul>
<p>
</p>
<p>
<img alt="" src="/app/webroot/userfiles/images/Vacancies/march%208%20pic%201.jpg" style="width: 800px; height: 600px;" /></p>
<p>
<strong> Banking candle stick chart</strong></p>
<p style="margin-left:.25in;">
</p>
<p style="margin-left:.25in;">
<strong>The top 5 scrips of banking in turnover are: </strong></p>
<table border="1" cellpadding="0" cellspacing="0">
<tbody>
<tr>
<td style="width:174px;height:22px;">
<p>
<strong>Scrips</strong></p>
</td>
<td style="width:176px;height:22px;">
<p>
<strong>Turnover</strong></p>
</td>
<td style="width:174px;height:22px;">
<p>
<strong>LTP</strong></p>
</td>
</tr>
<tr>
<td style="width:174px;height:22px;">
<p>
NCCB</p>
</td>
<td style="width:176px;height:22px;">
<p>
NRS. 1.282 crores</p>
</td>
<td style="width:174px;height:22px;">
<p>
210</p>
</td>
</tr>
<tr>
<td style="width:174px;height:21px;">
<p>
PRVU</p>
</td>
<td style="width:176px;height:21px;">
<p>
NRS. 1.046 crores</p>
</td>
<td style="width:174px;height:21px;">
<p>
224</p>
</td>
</tr>
<tr>
<td style="width:174px;height:22px;">
<p>
NICA</p>
</td>
<td style="width:176px;height:22px;">
<p>
NRs. 1.035 crores</p>
</td>
<td style="width:174px;height:22px;">
<p>
391</p>
</td>
</tr>
<tr>
<td style="width:174px;height:22px;">
<p>
CBBL</p>
</td>
<td style="width:176px;height:22px;">
<p>
NRs. 0.772 crores</p>
</td>
<td style="width:174px;height:22px;">
<p>
886</p>
</td>
</tr>
<tr>
<td style="width:174px;height:22px;">
<p>
CIT</p>
</td>
<td style="width:176px;height:22px;">
<p>
NRs. 0754 crores</p>
</td>
<td style="width:174px;height:22px;">
<p>
2,563</p>
</td>
</tr>
</tbody>
</table>
<p>
<strong>Conclusion</strong></p>
<p>
It is said that the stock market progressions are always process of anomalous and adventure.</p>
<p>
Sometimes lousy movements, sometimes very disciplined and calculative and sometimes very wild with high motility behaviors.</p>
<p>
For past few weeks markets have shown choppy to down trend Trading courses.</p>
<p>
But this few weeks market has shown a recovery sign both in Index value and volume.</p>
<p>
If we look at past years same months (magh, falgun and chaitra). The market had shown a recovery but only for short time. The market has shown a recovery but only for short time. The difference is the market turnover used to be more than Rs. 100 crores per day during last couple of years, but this time market turnover has been as meager Rs. 20 crores per day in average for long periods. Still, If analysis is to be made on volume side, though with meager, rise market show a sign of recovery with mild reliability.</p>
<p>
</p>
<p>
The support and resistant's on the charts have been distinguished on the charts below.</p>
<p>
</p>
<p>
<img alt="" src="/app/webroot/userfiles/images/Vacancies/march%208%20pic%202.jpg" style="width: 800px; height: 600px;" /></p>
<p>
<strong> NEPSE monthly chart with multiple support and resistant</strong></p>
<p>
</p>
<p>
a) Bearish channel, Strong support at 1064- 1040.</p>
<p>
b) Bullish channel, Strong Resistant at 1183- 1204.</p>
<p>
</p>
<p>
</p>
<p>
<img alt="" src="/app/webroot/userfiles/images/Vacancies/march%208%20pic%203.jpg" style="width: 800px; height: 600px;" /></p>
<p>
<strong> NEPSE weekly candle stick</strong></p>
<p>
a) Inside the bearish channel markets range for next few weeks are as:</p>
<p>
i) Current Market Price (CMP) = 1127.77</p>
<p>
ii) Support: Initial support = 1121.23</p>
<p>
Intermediary support =1098/1096</p>
<p>
Final support = 1065.11</p>
<p>
iii) Resistant: Initial resistant = 1148.81</p>
<p>
Final resistant = 1183.06</p>
<p>
b) Bullish engulfing candle stock pattern with mild reliability.</p>
<p>
</p>
<p>
<img alt="" src="/app/webroot/userfiles/images/Vacancies/march%208%20pic%204.jpg" style="width: 800px; height: 600px;" /></p>
<p>
<strong>Nepse daily candle stick</strong></p>
<p>
</p>
<p>
a) The market has been seemed to increase in its volume and index too.</p>
<p>
b) Some may want to sell and some may want to buy the share.</p>
<p>
c) The most increased points among all was of life insurance.</p>
<p>
</p>
<p>
<strong> Fundamentals:</strong></p>
<p>
1) Next week falgun closing is ahead.</p>
<p>
2) Next month 3rd fiscal quarterly closing starts.</p>
<p>
a) If banks are provided with enough liquidity, the current bullish market would be approved for </p>
<p>
further price gain.</p>
<p>
b) In case the banks are not comfortable with enough liquidity, chaitra 2nd/ 3rd week may face a </p>
<p>
panic sell in market.</p>
<p>
c) Since third quarter is in verge to close, government and its agency seems claiming a robust fiscal</p>
<p>
growth amid various challenges.</p>
<p>
d) The most important factor is, if government is ready to spend the allocated budget in chaitra? or</p>
<p>
will it wait for next month.</p>
<p>
</p>
<p>
</p>
<p>
</p>
<p>
<strong> Happy trading……..!!!!!!!</strong></p>
<p>
</p>
<p>
</p>
',
'published' => true,
'created' => '2019-03-08',
'modified' => '2019-03-08',
'keywords' => '',
'description' => '',
'sortorder' => '9986',
'image' => '20190308062910_march 8 pic 2.jpg',
'article_date' => '2019-03-08 00:00:00',
'homepage' => true,
'breaking_news' => false,
'main_news' => false,
'in_scroller' => false,
'user_id' => '22'
),
'ArticleCategory' => array(
'id' => '1',
'name' => 'NEWS',
'parentOf' => '0',
'published' => true,
'registered' => '2015-07-20 00:00:00',
'sortorder' => '158',
'del_flag' => '0',
'homepage' => true,
'display_in_menu' => true,
'user_id' => '1',
'created' => '0000-00-00 00:00:00',
'modified' => '2018-11-22 11:58:49'
),
'User' => array(
'password' => '*****',
'id' => '22',
'user_detail_id' => '1',
'group_id' => '24',
'username' => 'kishor.bam@newbusinessage.com',
'name' => '',
'email' => 'kishor.bam@newbusinessage.com',
'address' => '',
'gender' => '',
'access' => '1',
'phone' => '',
'access_type' => '0',
'activated' => false,
'sortorder' => '0',
'published' => '0',
'created' => '2018-11-30 10:47:22',
'last_login' => '2019-06-09 10:32:40',
'ip' => '202.63.242.112'
),
'ArticleComment' => array(),
'ArticleFeature' => array(),
'ArticleHasAuthor' => array(),
'ArticleHasTag' => array(),
'ArticleView' => array(
(int) 0 => array(
'article_id' => '10220',
'hit' => '1290'
)
),
'Slider' => array()
)
$current_user = null
$logged_in = false
$image = 'https://www.old.newbusinessage.com/app/webroot/img/news/20190308062910_march 8 pic 2.jpg'
$user = null
include - APP/View/Articles/view.ctp, line 115
View::_evaluate() - CORE/Cake/View/View.php, line 971
View::_render() - CORE/Cake/View/View.php, line 933
View::render() - CORE/Cake/View/View.php, line 473
Controller::render() - CORE/Cake/Controller/Controller.php, line 968
Dispatcher::_invoke() - CORE/Cake/Routing/Dispatcher.php, line 200
Dispatcher::dispatch() - CORE/Cake/Routing/Dispatcher.php, line 167
[main] - APP/webroot/index.php, line 117
Notice (8): Trying to access array offset on value of type null [APP/View/Articles/view.ctp, line 115]
$user = $this->Session->read('Auth.User');
//find the group of logged user
$groupId = $user['Group']['id'];
$viewFile = '/var/www/html/newbusinessage.com/app/View/Articles/view.ctp'
$dataForView = array(
'article' => array(
'Article' => array(
'id' => '10220',
'article_category_id' => '1',
'title' => 'Market Watch of March 7',
'sub_title' => '',
'summary' => 'The CMP of 23rd Falgun is 1,127.77 which are above the daily pivot of 1,122.41 as well as above the weekly pivot 1,118.16.',
'content' => '<p>
<strong>Current market price (CMP): </strong><strong>1,127.77</strong></p>
<p>
</p>
<p>
<strong>OHLC update of this week: </strong></p>
<p>
O: 1105.53</p>
<p>
H: 1127.77</p>
<p>
L: 1098.95</p>
<p>
C: 1127.77</p>
<p>
</p>
<p>
<strong>Pivot table for next week (26th to 30th falgun): </strong></p>
<table border="1" cellpadding="0" cellspacing="0">
<tbody>
<tr>
<td style="width:91px;">
<p align="center">
<strong>S3</strong></p>
</td>
<td style="width:91px;">
<p align="center">
<strong>S2</strong></p>
</td>
<td style="width:91px;">
<p align="center">
<strong>S1</strong></p>
</td>
<td style="width:91px;">
<p align="center">
<strong>Pivot</strong></p>
</td>
<td style="width:91px;">
<p align="center">
<strong>R1</strong></p>
</td>
<td style="width:91px;">
<p align="center">
<strong>R2</strong></p>
</td>
<td style="width:91px;">
<p align="center">
<strong>R3</strong></p>
</td>
</tr>
<tr>
<td style="width:91px;">
<p align="center">
1,079.74</p>
</td>
<td style="width:91px;">
<p align="center">
1,089.34</p>
</td>
<td style="width:91px;">
<p align="center">
1,108.56</p>
</td>
<td style="width:91px;">
<p align="center">
1,118.16</p>
</td>
<td style="width:91px;">
<p align="center">
1,137.38</p>
</td>
<td style="width:91px;">
<p align="center">
1,146.98</p>
</td>
<td style="width:91px;">
<p align="center">
1,166.2</p>
</td>
</tr>
</tbody>
</table>
<p align="center">
</p>
<p>
<strong>Pivot for this month:</strong></p>
<table align="left" border="1" cellpadding="0" cellspacing="0" style="width:658px;" width="658">
<tbody>
<tr>
<td style="width:94px;height:22px;">
<p style="text-align: center;">
<strong>S3</strong></p>
</td>
<td style="width:94px;height:22px;">
<p style="text-align: center;">
<strong>S2</strong></p>
</td>
<td style="width:94px;height:22px;">
<p style="text-align: center;">
<strong>S1</strong></p>
</td>
<td style="width:88px;height:22px;">
<p style="text-align: center;">
<strong>Pivot</strong></p>
</td>
<td style="width:96px;height:22px;">
<p style="text-align: center;">
<strong>R1</strong></p>
</td>
<td style="width:96px;height:22px;">
<p style="text-align: center;">
<strong>R2</strong></p>
</td>
<td style="width:96px;height:22px;">
<p style="text-align: center;">
<strong>R3</strong></p>
</td>
</tr>
<tr>
<td style="width:94px;height:22px;">
<p style="text-align: center;">
<strong>1025.74 </strong></p>
</td>
<td style="width:94px;height:22px;">
<p style="text-align: center;">
<strong>1075.08 </strong></p>
</td>
<td style="width:94px;height:22px;">
<p style="text-align: center;">
<strong>1101.64 </strong></p>
</td>
<td style="width:88px;height:22px;">
<p style="text-align: center;">
<strong>1150.98 </strong></p>
</td>
<td style="width:96px;height:22px;">
<p style="text-align: center;">
<strong>1177.54 </strong></p>
</td>
<td style="width:96px;height:22px;">
<p style="text-align: center;">
<strong>1226.88 </strong></p>
</td>
<td style="width:96px;height:22px;">
<p style="text-align: center;">
<strong>1253.44 </strong></p>
</td>
</tr>
</tbody>
</table>
<p style="text-align: center;">
</p>
<p style="text-align: center;">
</p>
<p style="text-align: center;">
</p>
<p>
<strong>Volume:</strong></p>
<p>
This week: 96.37 crores</p>
<p>
Last week: 79.75 crores</p>
<p align="center">
</p>
<p>
<strong>Projected range for next week: 1,113.36 to 1,142.18</strong></p>
<p>
<strong>OHLC update of 23<sup>rd</sup> Falgun:</strong></p>
<p>
O: 1111.76</p>
<p>
H: 1127.77</p>
<p>
L: 1111.70</p>
<p>
C: 1127.77</p>
<p>
<strong>Pivot table for 26<sup>th</sup> Falgun: </strong></p>
<table border="1" cellpadding="0" cellspacing="0">
<tbody>
<tr>
<td style="width:91px;">
<p align="center">
<strong>S3</strong></p>
</td>
<td style="width:91px;">
<p align="center">
<strong>S2</strong></p>
</td>
<td style="width:91px;">
<p align="center">
<strong>S1</strong></p>
</td>
<td style="width:91px;">
<p align="center">
<strong>Pivot</strong></p>
</td>
<td style="width:91px;">
<p align="center">
<strong>R1</strong></p>
</td>
<td style="width:91px;">
<p align="center">
<strong>R2</strong></p>
</td>
<td style="width:91px;">
<p align="center">
<strong>R3</strong></p>
</td>
</tr>
<tr>
<td style="width:91px;">
<p align="center">
1,100.99</p>
</td>
<td style="width:91px;">
<p align="center">
1,106.34</p>
</td>
<td style="width:91px;">
<p align="center">
1,117.06</p>
</td>
<td style="width:91px;">
<p align="center">
1,122.41</p>
</td>
<td style="width:91px;">
<p align="center">
1,133.13</p>
</td>
<td style="width:91px;">
<p align="center">
1,138.48</p>
</td>
<td style="width:91px;">
<p align="center">
1,149.2</p>
</td>
</tr>
</tbody>
</table>
<p align="center">
</p>
<p>
<strong>Turnover:</strong></p>
<p>
This week (19<sup>th</sup> to 23<sup>rd</sup> Falgun): 96.37 crores</p>
<p>
Last week (12<sup>th</sup> to 16<sup>th</sup> Falgun): 79.75 crores</p>
<p>
23<sup>rd</sup> Falgun: 29.39 crores</p>
<p>
</p>
<p>
<strong>Outlook: </strong></p>
<p>
The CMP of 23<sup>rd</sup> Falgun is 1,127.77 which are above the daily pivot of 1,122.41 as well as above the weekly pivot 1,118.16.</p>
<p>
</p>
<p>
<strong>Sub indices market information: </strong></p>
<ul>
<li>
- Life insurance has increased by 159.32 points in index value.</li>
<li>
- Non life insurance has increased by 105.24 points in index value.</li>
<li>
- Banking has increased by 13.92 points in index value.</li>
</ul>
<p>
</p>
<p>
<img alt="" src="/app/webroot/userfiles/images/Vacancies/march%208%20pic%201.jpg" style="width: 800px; height: 600px;" /></p>
<p>
<strong> Banking candle stick chart</strong></p>
<p style="margin-left:.25in;">
</p>
<p style="margin-left:.25in;">
<strong>The top 5 scrips of banking in turnover are: </strong></p>
<table border="1" cellpadding="0" cellspacing="0">
<tbody>
<tr>
<td style="width:174px;height:22px;">
<p>
<strong>Scrips</strong></p>
</td>
<td style="width:176px;height:22px;">
<p>
<strong>Turnover</strong></p>
</td>
<td style="width:174px;height:22px;">
<p>
<strong>LTP</strong></p>
</td>
</tr>
<tr>
<td style="width:174px;height:22px;">
<p>
NCCB</p>
</td>
<td style="width:176px;height:22px;">
<p>
NRS. 1.282 crores</p>
</td>
<td style="width:174px;height:22px;">
<p>
210</p>
</td>
</tr>
<tr>
<td style="width:174px;height:21px;">
<p>
PRVU</p>
</td>
<td style="width:176px;height:21px;">
<p>
NRS. 1.046 crores</p>
</td>
<td style="width:174px;height:21px;">
<p>
224</p>
</td>
</tr>
<tr>
<td style="width:174px;height:22px;">
<p>
NICA</p>
</td>
<td style="width:176px;height:22px;">
<p>
NRs. 1.035 crores</p>
</td>
<td style="width:174px;height:22px;">
<p>
391</p>
</td>
</tr>
<tr>
<td style="width:174px;height:22px;">
<p>
CBBL</p>
</td>
<td style="width:176px;height:22px;">
<p>
NRs. 0.772 crores</p>
</td>
<td style="width:174px;height:22px;">
<p>
886</p>
</td>
</tr>
<tr>
<td style="width:174px;height:22px;">
<p>
CIT</p>
</td>
<td style="width:176px;height:22px;">
<p>
NRs. 0754 crores</p>
</td>
<td style="width:174px;height:22px;">
<p>
2,563</p>
</td>
</tr>
</tbody>
</table>
<p>
<strong>Conclusion</strong></p>
<p>
It is said that the stock market progressions are always process of anomalous and adventure.</p>
<p>
Sometimes lousy movements, sometimes very disciplined and calculative and sometimes very wild with high motility behaviors.</p>
<p>
For past few weeks markets have shown choppy to down trend Trading courses.</p>
<p>
But this few weeks market has shown a recovery sign both in Index value and volume.</p>
<p>
If we look at past years same months (magh, falgun and chaitra). The market had shown a recovery but only for short time. The market has shown a recovery but only for short time. The difference is the market turnover used to be more than Rs. 100 crores per day during last couple of years, but this time market turnover has been as meager Rs. 20 crores per day in average for long periods. Still, If analysis is to be made on volume side, though with meager, rise market show a sign of recovery with mild reliability.</p>
<p>
</p>
<p>
The support and resistant's on the charts have been distinguished on the charts below.</p>
<p>
</p>
<p>
<img alt="" src="/app/webroot/userfiles/images/Vacancies/march%208%20pic%202.jpg" style="width: 800px; height: 600px;" /></p>
<p>
<strong> NEPSE monthly chart with multiple support and resistant</strong></p>
<p>
</p>
<p>
a) Bearish channel, Strong support at 1064- 1040.</p>
<p>
b) Bullish channel, Strong Resistant at 1183- 1204.</p>
<p>
</p>
<p>
</p>
<p>
<img alt="" src="/app/webroot/userfiles/images/Vacancies/march%208%20pic%203.jpg" style="width: 800px; height: 600px;" /></p>
<p>
<strong> NEPSE weekly candle stick</strong></p>
<p>
a) Inside the bearish channel markets range for next few weeks are as:</p>
<p>
i) Current Market Price (CMP) = 1127.77</p>
<p>
ii) Support: Initial support = 1121.23</p>
<p>
Intermediary support =1098/1096</p>
<p>
Final support = 1065.11</p>
<p>
iii) Resistant: Initial resistant = 1148.81</p>
<p>
Final resistant = 1183.06</p>
<p>
b) Bullish engulfing candle stock pattern with mild reliability.</p>
<p>
</p>
<p>
<img alt="" src="/app/webroot/userfiles/images/Vacancies/march%208%20pic%204.jpg" style="width: 800px; height: 600px;" /></p>
<p>
<strong>Nepse daily candle stick</strong></p>
<p>
</p>
<p>
a) The market has been seemed to increase in its volume and index too.</p>
<p>
b) Some may want to sell and some may want to buy the share.</p>
<p>
c) The most increased points among all was of life insurance.</p>
<p>
</p>
<p>
<strong> Fundamentals:</strong></p>
<p>
1) Next week falgun closing is ahead.</p>
<p>
2) Next month 3rd fiscal quarterly closing starts.</p>
<p>
a) If banks are provided with enough liquidity, the current bullish market would be approved for </p>
<p>
further price gain.</p>
<p>
b) In case the banks are not comfortable with enough liquidity, chaitra 2nd/ 3rd week may face a </p>
<p>
panic sell in market.</p>
<p>
c) Since third quarter is in verge to close, government and its agency seems claiming a robust fiscal</p>
<p>
growth amid various challenges.</p>
<p>
d) The most important factor is, if government is ready to spend the allocated budget in chaitra? or</p>
<p>
will it wait for next month.</p>
<p>
</p>
<p>
</p>
<p>
</p>
<p>
<strong> Happy trading……..!!!!!!!</strong></p>
<p>
</p>
<p>
</p>
',
'published' => true,
'created' => '2019-03-08',
'modified' => '2019-03-08',
'keywords' => '',
'description' => '',
'sortorder' => '9986',
'image' => '20190308062910_march 8 pic 2.jpg',
'article_date' => '2019-03-08 00:00:00',
'homepage' => true,
'breaking_news' => false,
'main_news' => false,
'in_scroller' => false,
'user_id' => '22'
),
'ArticleCategory' => array(
'id' => '1',
'name' => 'NEWS',
'parentOf' => '0',
'published' => true,
'registered' => '2015-07-20 00:00:00',
'sortorder' => '158',
'del_flag' => '0',
'homepage' => true,
'display_in_menu' => true,
'user_id' => '1',
'created' => '0000-00-00 00:00:00',
'modified' => '2018-11-22 11:58:49'
),
'User' => array(
'password' => '*****',
'id' => '22',
'user_detail_id' => '1',
'group_id' => '24',
'username' => 'kishor.bam@newbusinessage.com',
'name' => '',
'email' => 'kishor.bam@newbusinessage.com',
'address' => '',
'gender' => '',
'access' => '1',
'phone' => '',
'access_type' => '0',
'activated' => false,
'sortorder' => '0',
'published' => '0',
'created' => '2018-11-30 10:47:22',
'last_login' => '2019-06-09 10:32:40',
'ip' => '202.63.242.112'
),
'ArticleComment' => array(),
'ArticleFeature' => array(),
'ArticleHasAuthor' => array(),
'ArticleHasTag' => array(),
'ArticleView' => array(
(int) 0 => array(
[maximum depth reached]
)
),
'Slider' => array()
),
'current_user' => null,
'logged_in' => false
)
$article = array(
'Article' => array(
'id' => '10220',
'article_category_id' => '1',
'title' => 'Market Watch of March 7',
'sub_title' => '',
'summary' => 'The CMP of 23rd Falgun is 1,127.77 which are above the daily pivot of 1,122.41 as well as above the weekly pivot 1,118.16.',
'content' => '<p>
<strong>Current market price (CMP): </strong><strong>1,127.77</strong></p>
<p>
</p>
<p>
<strong>OHLC update of this week: </strong></p>
<p>
O: 1105.53</p>
<p>
H: 1127.77</p>
<p>
L: 1098.95</p>
<p>
C: 1127.77</p>
<p>
</p>
<p>
<strong>Pivot table for next week (26th to 30th falgun): </strong></p>
<table border="1" cellpadding="0" cellspacing="0">
<tbody>
<tr>
<td style="width:91px;">
<p align="center">
<strong>S3</strong></p>
</td>
<td style="width:91px;">
<p align="center">
<strong>S2</strong></p>
</td>
<td style="width:91px;">
<p align="center">
<strong>S1</strong></p>
</td>
<td style="width:91px;">
<p align="center">
<strong>Pivot</strong></p>
</td>
<td style="width:91px;">
<p align="center">
<strong>R1</strong></p>
</td>
<td style="width:91px;">
<p align="center">
<strong>R2</strong></p>
</td>
<td style="width:91px;">
<p align="center">
<strong>R3</strong></p>
</td>
</tr>
<tr>
<td style="width:91px;">
<p align="center">
1,079.74</p>
</td>
<td style="width:91px;">
<p align="center">
1,089.34</p>
</td>
<td style="width:91px;">
<p align="center">
1,108.56</p>
</td>
<td style="width:91px;">
<p align="center">
1,118.16</p>
</td>
<td style="width:91px;">
<p align="center">
1,137.38</p>
</td>
<td style="width:91px;">
<p align="center">
1,146.98</p>
</td>
<td style="width:91px;">
<p align="center">
1,166.2</p>
</td>
</tr>
</tbody>
</table>
<p align="center">
</p>
<p>
<strong>Pivot for this month:</strong></p>
<table align="left" border="1" cellpadding="0" cellspacing="0" style="width:658px;" width="658">
<tbody>
<tr>
<td style="width:94px;height:22px;">
<p style="text-align: center;">
<strong>S3</strong></p>
</td>
<td style="width:94px;height:22px;">
<p style="text-align: center;">
<strong>S2</strong></p>
</td>
<td style="width:94px;height:22px;">
<p style="text-align: center;">
<strong>S1</strong></p>
</td>
<td style="width:88px;height:22px;">
<p style="text-align: center;">
<strong>Pivot</strong></p>
</td>
<td style="width:96px;height:22px;">
<p style="text-align: center;">
<strong>R1</strong></p>
</td>
<td style="width:96px;height:22px;">
<p style="text-align: center;">
<strong>R2</strong></p>
</td>
<td style="width:96px;height:22px;">
<p style="text-align: center;">
<strong>R3</strong></p>
</td>
</tr>
<tr>
<td style="width:94px;height:22px;">
<p style="text-align: center;">
<strong>1025.74 </strong></p>
</td>
<td style="width:94px;height:22px;">
<p style="text-align: center;">
<strong>1075.08 </strong></p>
</td>
<td style="width:94px;height:22px;">
<p style="text-align: center;">
<strong>1101.64 </strong></p>
</td>
<td style="width:88px;height:22px;">
<p style="text-align: center;">
<strong>1150.98 </strong></p>
</td>
<td style="width:96px;height:22px;">
<p style="text-align: center;">
<strong>1177.54 </strong></p>
</td>
<td style="width:96px;height:22px;">
<p style="text-align: center;">
<strong>1226.88 </strong></p>
</td>
<td style="width:96px;height:22px;">
<p style="text-align: center;">
<strong>1253.44 </strong></p>
</td>
</tr>
</tbody>
</table>
<p style="text-align: center;">
</p>
<p style="text-align: center;">
</p>
<p style="text-align: center;">
</p>
<p>
<strong>Volume:</strong></p>
<p>
This week: 96.37 crores</p>
<p>
Last week: 79.75 crores</p>
<p align="center">
</p>
<p>
<strong>Projected range for next week: 1,113.36 to 1,142.18</strong></p>
<p>
<strong>OHLC update of 23<sup>rd</sup> Falgun:</strong></p>
<p>
O: 1111.76</p>
<p>
H: 1127.77</p>
<p>
L: 1111.70</p>
<p>
C: 1127.77</p>
<p>
<strong>Pivot table for 26<sup>th</sup> Falgun: </strong></p>
<table border="1" cellpadding="0" cellspacing="0">
<tbody>
<tr>
<td style="width:91px;">
<p align="center">
<strong>S3</strong></p>
</td>
<td style="width:91px;">
<p align="center">
<strong>S2</strong></p>
</td>
<td style="width:91px;">
<p align="center">
<strong>S1</strong></p>
</td>
<td style="width:91px;">
<p align="center">
<strong>Pivot</strong></p>
</td>
<td style="width:91px;">
<p align="center">
<strong>R1</strong></p>
</td>
<td style="width:91px;">
<p align="center">
<strong>R2</strong></p>
</td>
<td style="width:91px;">
<p align="center">
<strong>R3</strong></p>
</td>
</tr>
<tr>
<td style="width:91px;">
<p align="center">
1,100.99</p>
</td>
<td style="width:91px;">
<p align="center">
1,106.34</p>
</td>
<td style="width:91px;">
<p align="center">
1,117.06</p>
</td>
<td style="width:91px;">
<p align="center">
1,122.41</p>
</td>
<td style="width:91px;">
<p align="center">
1,133.13</p>
</td>
<td style="width:91px;">
<p align="center">
1,138.48</p>
</td>
<td style="width:91px;">
<p align="center">
1,149.2</p>
</td>
</tr>
</tbody>
</table>
<p align="center">
</p>
<p>
<strong>Turnover:</strong></p>
<p>
This week (19<sup>th</sup> to 23<sup>rd</sup> Falgun): 96.37 crores</p>
<p>
Last week (12<sup>th</sup> to 16<sup>th</sup> Falgun): 79.75 crores</p>
<p>
23<sup>rd</sup> Falgun: 29.39 crores</p>
<p>
</p>
<p>
<strong>Outlook: </strong></p>
<p>
The CMP of 23<sup>rd</sup> Falgun is 1,127.77 which are above the daily pivot of 1,122.41 as well as above the weekly pivot 1,118.16.</p>
<p>
</p>
<p>
<strong>Sub indices market information: </strong></p>
<ul>
<li>
- Life insurance has increased by 159.32 points in index value.</li>
<li>
- Non life insurance has increased by 105.24 points in index value.</li>
<li>
- Banking has increased by 13.92 points in index value.</li>
</ul>
<p>
</p>
<p>
<img alt="" src="/app/webroot/userfiles/images/Vacancies/march%208%20pic%201.jpg" style="width: 800px; height: 600px;" /></p>
<p>
<strong> Banking candle stick chart</strong></p>
<p style="margin-left:.25in;">
</p>
<p style="margin-left:.25in;">
<strong>The top 5 scrips of banking in turnover are: </strong></p>
<table border="1" cellpadding="0" cellspacing="0">
<tbody>
<tr>
<td style="width:174px;height:22px;">
<p>
<strong>Scrips</strong></p>
</td>
<td style="width:176px;height:22px;">
<p>
<strong>Turnover</strong></p>
</td>
<td style="width:174px;height:22px;">
<p>
<strong>LTP</strong></p>
</td>
</tr>
<tr>
<td style="width:174px;height:22px;">
<p>
NCCB</p>
</td>
<td style="width:176px;height:22px;">
<p>
NRS. 1.282 crores</p>
</td>
<td style="width:174px;height:22px;">
<p>
210</p>
</td>
</tr>
<tr>
<td style="width:174px;height:21px;">
<p>
PRVU</p>
</td>
<td style="width:176px;height:21px;">
<p>
NRS. 1.046 crores</p>
</td>
<td style="width:174px;height:21px;">
<p>
224</p>
</td>
</tr>
<tr>
<td style="width:174px;height:22px;">
<p>
NICA</p>
</td>
<td style="width:176px;height:22px;">
<p>
NRs. 1.035 crores</p>
</td>
<td style="width:174px;height:22px;">
<p>
391</p>
</td>
</tr>
<tr>
<td style="width:174px;height:22px;">
<p>
CBBL</p>
</td>
<td style="width:176px;height:22px;">
<p>
NRs. 0.772 crores</p>
</td>
<td style="width:174px;height:22px;">
<p>
886</p>
</td>
</tr>
<tr>
<td style="width:174px;height:22px;">
<p>
CIT</p>
</td>
<td style="width:176px;height:22px;">
<p>
NRs. 0754 crores</p>
</td>
<td style="width:174px;height:22px;">
<p>
2,563</p>
</td>
</tr>
</tbody>
</table>
<p>
<strong>Conclusion</strong></p>
<p>
It is said that the stock market progressions are always process of anomalous and adventure.</p>
<p>
Sometimes lousy movements, sometimes very disciplined and calculative and sometimes very wild with high motility behaviors.</p>
<p>
For past few weeks markets have shown choppy to down trend Trading courses.</p>
<p>
But this few weeks market has shown a recovery sign both in Index value and volume.</p>
<p>
If we look at past years same months (magh, falgun and chaitra). The market had shown a recovery but only for short time. The market has shown a recovery but only for short time. The difference is the market turnover used to be more than Rs. 100 crores per day during last couple of years, but this time market turnover has been as meager Rs. 20 crores per day in average for long periods. Still, If analysis is to be made on volume side, though with meager, rise market show a sign of recovery with mild reliability.</p>
<p>
</p>
<p>
The support and resistant's on the charts have been distinguished on the charts below.</p>
<p>
</p>
<p>
<img alt="" src="/app/webroot/userfiles/images/Vacancies/march%208%20pic%202.jpg" style="width: 800px; height: 600px;" /></p>
<p>
<strong> NEPSE monthly chart with multiple support and resistant</strong></p>
<p>
</p>
<p>
a) Bearish channel, Strong support at 1064- 1040.</p>
<p>
b) Bullish channel, Strong Resistant at 1183- 1204.</p>
<p>
</p>
<p>
</p>
<p>
<img alt="" src="/app/webroot/userfiles/images/Vacancies/march%208%20pic%203.jpg" style="width: 800px; height: 600px;" /></p>
<p>
<strong> NEPSE weekly candle stick</strong></p>
<p>
a) Inside the bearish channel markets range for next few weeks are as:</p>
<p>
i) Current Market Price (CMP) = 1127.77</p>
<p>
ii) Support: Initial support = 1121.23</p>
<p>
Intermediary support =1098/1096</p>
<p>
Final support = 1065.11</p>
<p>
iii) Resistant: Initial resistant = 1148.81</p>
<p>
Final resistant = 1183.06</p>
<p>
b) Bullish engulfing candle stock pattern with mild reliability.</p>
<p>
</p>
<p>
<img alt="" src="/app/webroot/userfiles/images/Vacancies/march%208%20pic%204.jpg" style="width: 800px; height: 600px;" /></p>
<p>
<strong>Nepse daily candle stick</strong></p>
<p>
</p>
<p>
a) The market has been seemed to increase in its volume and index too.</p>
<p>
b) Some may want to sell and some may want to buy the share.</p>
<p>
c) The most increased points among all was of life insurance.</p>
<p>
</p>
<p>
<strong> Fundamentals:</strong></p>
<p>
1) Next week falgun closing is ahead.</p>
<p>
2) Next month 3rd fiscal quarterly closing starts.</p>
<p>
a) If banks are provided with enough liquidity, the current bullish market would be approved for </p>
<p>
further price gain.</p>
<p>
b) In case the banks are not comfortable with enough liquidity, chaitra 2nd/ 3rd week may face a </p>
<p>
panic sell in market.</p>
<p>
c) Since third quarter is in verge to close, government and its agency seems claiming a robust fiscal</p>
<p>
growth amid various challenges.</p>
<p>
d) The most important factor is, if government is ready to spend the allocated budget in chaitra? or</p>
<p>
will it wait for next month.</p>
<p>
</p>
<p>
</p>
<p>
</p>
<p>
<strong> Happy trading……..!!!!!!!</strong></p>
<p>
</p>
<p>
</p>
',
'published' => true,
'created' => '2019-03-08',
'modified' => '2019-03-08',
'keywords' => '',
'description' => '',
'sortorder' => '9986',
'image' => '20190308062910_march 8 pic 2.jpg',
'article_date' => '2019-03-08 00:00:00',
'homepage' => true,
'breaking_news' => false,
'main_news' => false,
'in_scroller' => false,
'user_id' => '22'
),
'ArticleCategory' => array(
'id' => '1',
'name' => 'NEWS',
'parentOf' => '0',
'published' => true,
'registered' => '2015-07-20 00:00:00',
'sortorder' => '158',
'del_flag' => '0',
'homepage' => true,
'display_in_menu' => true,
'user_id' => '1',
'created' => '0000-00-00 00:00:00',
'modified' => '2018-11-22 11:58:49'
),
'User' => array(
'password' => '*****',
'id' => '22',
'user_detail_id' => '1',
'group_id' => '24',
'username' => 'kishor.bam@newbusinessage.com',
'name' => '',
'email' => 'kishor.bam@newbusinessage.com',
'address' => '',
'gender' => '',
'access' => '1',
'phone' => '',
'access_type' => '0',
'activated' => false,
'sortorder' => '0',
'published' => '0',
'created' => '2018-11-30 10:47:22',
'last_login' => '2019-06-09 10:32:40',
'ip' => '202.63.242.112'
),
'ArticleComment' => array(),
'ArticleFeature' => array(),
'ArticleHasAuthor' => array(),
'ArticleHasTag' => array(),
'ArticleView' => array(
(int) 0 => array(
'article_id' => '10220',
'hit' => '1290'
)
),
'Slider' => array()
)
$current_user = null
$logged_in = false
$image = 'https://www.old.newbusinessage.com/app/webroot/img/news/20190308062910_march 8 pic 2.jpg'
$user = null
include - APP/View/Articles/view.ctp, line 115
View::_evaluate() - CORE/Cake/View/View.php, line 971
View::_render() - CORE/Cake/View/View.php, line 933
View::render() - CORE/Cake/View/View.php, line 473
Controller::render() - CORE/Cake/Controller/Controller.php, line 968
Dispatcher::_invoke() - CORE/Cake/Routing/Dispatcher.php, line 200
Dispatcher::dispatch() - CORE/Cake/Routing/Dispatcher.php, line 167
[main] - APP/webroot/index.php, line 117
Notice (8): Trying to access array offset on value of type null [APP/View/Articles/view.ctp, line 116]
//find the group of logged user
$groupId = $user['Group']['id'];
$user_id=$user["id"];
$viewFile = '/var/www/html/newbusinessage.com/app/View/Articles/view.ctp'
$dataForView = array(
'article' => array(
'Article' => array(
'id' => '10220',
'article_category_id' => '1',
'title' => 'Market Watch of March 7',
'sub_title' => '',
'summary' => 'The CMP of 23rd Falgun is 1,127.77 which are above the daily pivot of 1,122.41 as well as above the weekly pivot 1,118.16.',
'content' => '<p>
<strong>Current market price (CMP): </strong><strong>1,127.77</strong></p>
<p>
</p>
<p>
<strong>OHLC update of this week: </strong></p>
<p>
O: 1105.53</p>
<p>
H: 1127.77</p>
<p>
L: 1098.95</p>
<p>
C: 1127.77</p>
<p>
</p>
<p>
<strong>Pivot table for next week (26th to 30th falgun): </strong></p>
<table border="1" cellpadding="0" cellspacing="0">
<tbody>
<tr>
<td style="width:91px;">
<p align="center">
<strong>S3</strong></p>
</td>
<td style="width:91px;">
<p align="center">
<strong>S2</strong></p>
</td>
<td style="width:91px;">
<p align="center">
<strong>S1</strong></p>
</td>
<td style="width:91px;">
<p align="center">
<strong>Pivot</strong></p>
</td>
<td style="width:91px;">
<p align="center">
<strong>R1</strong></p>
</td>
<td style="width:91px;">
<p align="center">
<strong>R2</strong></p>
</td>
<td style="width:91px;">
<p align="center">
<strong>R3</strong></p>
</td>
</tr>
<tr>
<td style="width:91px;">
<p align="center">
1,079.74</p>
</td>
<td style="width:91px;">
<p align="center">
1,089.34</p>
</td>
<td style="width:91px;">
<p align="center">
1,108.56</p>
</td>
<td style="width:91px;">
<p align="center">
1,118.16</p>
</td>
<td style="width:91px;">
<p align="center">
1,137.38</p>
</td>
<td style="width:91px;">
<p align="center">
1,146.98</p>
</td>
<td style="width:91px;">
<p align="center">
1,166.2</p>
</td>
</tr>
</tbody>
</table>
<p align="center">
</p>
<p>
<strong>Pivot for this month:</strong></p>
<table align="left" border="1" cellpadding="0" cellspacing="0" style="width:658px;" width="658">
<tbody>
<tr>
<td style="width:94px;height:22px;">
<p style="text-align: center;">
<strong>S3</strong></p>
</td>
<td style="width:94px;height:22px;">
<p style="text-align: center;">
<strong>S2</strong></p>
</td>
<td style="width:94px;height:22px;">
<p style="text-align: center;">
<strong>S1</strong></p>
</td>
<td style="width:88px;height:22px;">
<p style="text-align: center;">
<strong>Pivot</strong></p>
</td>
<td style="width:96px;height:22px;">
<p style="text-align: center;">
<strong>R1</strong></p>
</td>
<td style="width:96px;height:22px;">
<p style="text-align: center;">
<strong>R2</strong></p>
</td>
<td style="width:96px;height:22px;">
<p style="text-align: center;">
<strong>R3</strong></p>
</td>
</tr>
<tr>
<td style="width:94px;height:22px;">
<p style="text-align: center;">
<strong>1025.74 </strong></p>
</td>
<td style="width:94px;height:22px;">
<p style="text-align: center;">
<strong>1075.08 </strong></p>
</td>
<td style="width:94px;height:22px;">
<p style="text-align: center;">
<strong>1101.64 </strong></p>
</td>
<td style="width:88px;height:22px;">
<p style="text-align: center;">
<strong>1150.98 </strong></p>
</td>
<td style="width:96px;height:22px;">
<p style="text-align: center;">
<strong>1177.54 </strong></p>
</td>
<td style="width:96px;height:22px;">
<p style="text-align: center;">
<strong>1226.88 </strong></p>
</td>
<td style="width:96px;height:22px;">
<p style="text-align: center;">
<strong>1253.44 </strong></p>
</td>
</tr>
</tbody>
</table>
<p style="text-align: center;">
</p>
<p style="text-align: center;">
</p>
<p style="text-align: center;">
</p>
<p>
<strong>Volume:</strong></p>
<p>
This week: 96.37 crores</p>
<p>
Last week: 79.75 crores</p>
<p align="center">
</p>
<p>
<strong>Projected range for next week: 1,113.36 to 1,142.18</strong></p>
<p>
<strong>OHLC update of 23<sup>rd</sup> Falgun:</strong></p>
<p>
O: 1111.76</p>
<p>
H: 1127.77</p>
<p>
L: 1111.70</p>
<p>
C: 1127.77</p>
<p>
<strong>Pivot table for 26<sup>th</sup> Falgun: </strong></p>
<table border="1" cellpadding="0" cellspacing="0">
<tbody>
<tr>
<td style="width:91px;">
<p align="center">
<strong>S3</strong></p>
</td>
<td style="width:91px;">
<p align="center">
<strong>S2</strong></p>
</td>
<td style="width:91px;">
<p align="center">
<strong>S1</strong></p>
</td>
<td style="width:91px;">
<p align="center">
<strong>Pivot</strong></p>
</td>
<td style="width:91px;">
<p align="center">
<strong>R1</strong></p>
</td>
<td style="width:91px;">
<p align="center">
<strong>R2</strong></p>
</td>
<td style="width:91px;">
<p align="center">
<strong>R3</strong></p>
</td>
</tr>
<tr>
<td style="width:91px;">
<p align="center">
1,100.99</p>
</td>
<td style="width:91px;">
<p align="center">
1,106.34</p>
</td>
<td style="width:91px;">
<p align="center">
1,117.06</p>
</td>
<td style="width:91px;">
<p align="center">
1,122.41</p>
</td>
<td style="width:91px;">
<p align="center">
1,133.13</p>
</td>
<td style="width:91px;">
<p align="center">
1,138.48</p>
</td>
<td style="width:91px;">
<p align="center">
1,149.2</p>
</td>
</tr>
</tbody>
</table>
<p align="center">
</p>
<p>
<strong>Turnover:</strong></p>
<p>
This week (19<sup>th</sup> to 23<sup>rd</sup> Falgun): 96.37 crores</p>
<p>
Last week (12<sup>th</sup> to 16<sup>th</sup> Falgun): 79.75 crores</p>
<p>
23<sup>rd</sup> Falgun: 29.39 crores</p>
<p>
</p>
<p>
<strong>Outlook: </strong></p>
<p>
The CMP of 23<sup>rd</sup> Falgun is 1,127.77 which are above the daily pivot of 1,122.41 as well as above the weekly pivot 1,118.16.</p>
<p>
</p>
<p>
<strong>Sub indices market information: </strong></p>
<ul>
<li>
- Life insurance has increased by 159.32 points in index value.</li>
<li>
- Non life insurance has increased by 105.24 points in index value.</li>
<li>
- Banking has increased by 13.92 points in index value.</li>
</ul>
<p>
</p>
<p>
<img alt="" src="/app/webroot/userfiles/images/Vacancies/march%208%20pic%201.jpg" style="width: 800px; height: 600px;" /></p>
<p>
<strong> Banking candle stick chart</strong></p>
<p style="margin-left:.25in;">
</p>
<p style="margin-left:.25in;">
<strong>The top 5 scrips of banking in turnover are: </strong></p>
<table border="1" cellpadding="0" cellspacing="0">
<tbody>
<tr>
<td style="width:174px;height:22px;">
<p>
<strong>Scrips</strong></p>
</td>
<td style="width:176px;height:22px;">
<p>
<strong>Turnover</strong></p>
</td>
<td style="width:174px;height:22px;">
<p>
<strong>LTP</strong></p>
</td>
</tr>
<tr>
<td style="width:174px;height:22px;">
<p>
NCCB</p>
</td>
<td style="width:176px;height:22px;">
<p>
NRS. 1.282 crores</p>
</td>
<td style="width:174px;height:22px;">
<p>
210</p>
</td>
</tr>
<tr>
<td style="width:174px;height:21px;">
<p>
PRVU</p>
</td>
<td style="width:176px;height:21px;">
<p>
NRS. 1.046 crores</p>
</td>
<td style="width:174px;height:21px;">
<p>
224</p>
</td>
</tr>
<tr>
<td style="width:174px;height:22px;">
<p>
NICA</p>
</td>
<td style="width:176px;height:22px;">
<p>
NRs. 1.035 crores</p>
</td>
<td style="width:174px;height:22px;">
<p>
391</p>
</td>
</tr>
<tr>
<td style="width:174px;height:22px;">
<p>
CBBL</p>
</td>
<td style="width:176px;height:22px;">
<p>
NRs. 0.772 crores</p>
</td>
<td style="width:174px;height:22px;">
<p>
886</p>
</td>
</tr>
<tr>
<td style="width:174px;height:22px;">
<p>
CIT</p>
</td>
<td style="width:176px;height:22px;">
<p>
NRs. 0754 crores</p>
</td>
<td style="width:174px;height:22px;">
<p>
2,563</p>
</td>
</tr>
</tbody>
</table>
<p>
<strong>Conclusion</strong></p>
<p>
It is said that the stock market progressions are always process of anomalous and adventure.</p>
<p>
Sometimes lousy movements, sometimes very disciplined and calculative and sometimes very wild with high motility behaviors.</p>
<p>
For past few weeks markets have shown choppy to down trend Trading courses.</p>
<p>
But this few weeks market has shown a recovery sign both in Index value and volume.</p>
<p>
If we look at past years same months (magh, falgun and chaitra). The market had shown a recovery but only for short time. The market has shown a recovery but only for short time. The difference is the market turnover used to be more than Rs. 100 crores per day during last couple of years, but this time market turnover has been as meager Rs. 20 crores per day in average for long periods. Still, If analysis is to be made on volume side, though with meager, rise market show a sign of recovery with mild reliability.</p>
<p>
</p>
<p>
The support and resistant's on the charts have been distinguished on the charts below.</p>
<p>
</p>
<p>
<img alt="" src="/app/webroot/userfiles/images/Vacancies/march%208%20pic%202.jpg" style="width: 800px; height: 600px;" /></p>
<p>
<strong> NEPSE monthly chart with multiple support and resistant</strong></p>
<p>
</p>
<p>
a) Bearish channel, Strong support at 1064- 1040.</p>
<p>
b) Bullish channel, Strong Resistant at 1183- 1204.</p>
<p>
</p>
<p>
</p>
<p>
<img alt="" src="/app/webroot/userfiles/images/Vacancies/march%208%20pic%203.jpg" style="width: 800px; height: 600px;" /></p>
<p>
<strong> NEPSE weekly candle stick</strong></p>
<p>
a) Inside the bearish channel markets range for next few weeks are as:</p>
<p>
i) Current Market Price (CMP) = 1127.77</p>
<p>
ii) Support: Initial support = 1121.23</p>
<p>
Intermediary support =1098/1096</p>
<p>
Final support = 1065.11</p>
<p>
iii) Resistant: Initial resistant = 1148.81</p>
<p>
Final resistant = 1183.06</p>
<p>
b) Bullish engulfing candle stock pattern with mild reliability.</p>
<p>
</p>
<p>
<img alt="" src="/app/webroot/userfiles/images/Vacancies/march%208%20pic%204.jpg" style="width: 800px; height: 600px;" /></p>
<p>
<strong>Nepse daily candle stick</strong></p>
<p>
</p>
<p>
a) The market has been seemed to increase in its volume and index too.</p>
<p>
b) Some may want to sell and some may want to buy the share.</p>
<p>
c) The most increased points among all was of life insurance.</p>
<p>
</p>
<p>
<strong> Fundamentals:</strong></p>
<p>
1) Next week falgun closing is ahead.</p>
<p>
2) Next month 3rd fiscal quarterly closing starts.</p>
<p>
a) If banks are provided with enough liquidity, the current bullish market would be approved for </p>
<p>
further price gain.</p>
<p>
b) In case the banks are not comfortable with enough liquidity, chaitra 2nd/ 3rd week may face a </p>
<p>
panic sell in market.</p>
<p>
c) Since third quarter is in verge to close, government and its agency seems claiming a robust fiscal</p>
<p>
growth amid various challenges.</p>
<p>
d) The most important factor is, if government is ready to spend the allocated budget in chaitra? or</p>
<p>
will it wait for next month.</p>
<p>
</p>
<p>
</p>
<p>
</p>
<p>
<strong> Happy trading……..!!!!!!!</strong></p>
<p>
</p>
<p>
</p>
',
'published' => true,
'created' => '2019-03-08',
'modified' => '2019-03-08',
'keywords' => '',
'description' => '',
'sortorder' => '9986',
'image' => '20190308062910_march 8 pic 2.jpg',
'article_date' => '2019-03-08 00:00:00',
'homepage' => true,
'breaking_news' => false,
'main_news' => false,
'in_scroller' => false,
'user_id' => '22'
),
'ArticleCategory' => array(
'id' => '1',
'name' => 'NEWS',
'parentOf' => '0',
'published' => true,
'registered' => '2015-07-20 00:00:00',
'sortorder' => '158',
'del_flag' => '0',
'homepage' => true,
'display_in_menu' => true,
'user_id' => '1',
'created' => '0000-00-00 00:00:00',
'modified' => '2018-11-22 11:58:49'
),
'User' => array(
'password' => '*****',
'id' => '22',
'user_detail_id' => '1',
'group_id' => '24',
'username' => 'kishor.bam@newbusinessage.com',
'name' => '',
'email' => 'kishor.bam@newbusinessage.com',
'address' => '',
'gender' => '',
'access' => '1',
'phone' => '',
'access_type' => '0',
'activated' => false,
'sortorder' => '0',
'published' => '0',
'created' => '2018-11-30 10:47:22',
'last_login' => '2019-06-09 10:32:40',
'ip' => '202.63.242.112'
),
'ArticleComment' => array(),
'ArticleFeature' => array(),
'ArticleHasAuthor' => array(),
'ArticleHasTag' => array(),
'ArticleView' => array(
(int) 0 => array(
[maximum depth reached]
)
),
'Slider' => array()
),
'current_user' => null,
'logged_in' => false
)
$article = array(
'Article' => array(
'id' => '10220',
'article_category_id' => '1',
'title' => 'Market Watch of March 7',
'sub_title' => '',
'summary' => 'The CMP of 23rd Falgun is 1,127.77 which are above the daily pivot of 1,122.41 as well as above the weekly pivot 1,118.16.',
'content' => '<p>
<strong>Current market price (CMP): </strong><strong>1,127.77</strong></p>
<p>
</p>
<p>
<strong>OHLC update of this week: </strong></p>
<p>
O: 1105.53</p>
<p>
H: 1127.77</p>
<p>
L: 1098.95</p>
<p>
C: 1127.77</p>
<p>
</p>
<p>
<strong>Pivot table for next week (26th to 30th falgun): </strong></p>
<table border="1" cellpadding="0" cellspacing="0">
<tbody>
<tr>
<td style="width:91px;">
<p align="center">
<strong>S3</strong></p>
</td>
<td style="width:91px;">
<p align="center">
<strong>S2</strong></p>
</td>
<td style="width:91px;">
<p align="center">
<strong>S1</strong></p>
</td>
<td style="width:91px;">
<p align="center">
<strong>Pivot</strong></p>
</td>
<td style="width:91px;">
<p align="center">
<strong>R1</strong></p>
</td>
<td style="width:91px;">
<p align="center">
<strong>R2</strong></p>
</td>
<td style="width:91px;">
<p align="center">
<strong>R3</strong></p>
</td>
</tr>
<tr>
<td style="width:91px;">
<p align="center">
1,079.74</p>
</td>
<td style="width:91px;">
<p align="center">
1,089.34</p>
</td>
<td style="width:91px;">
<p align="center">
1,108.56</p>
</td>
<td style="width:91px;">
<p align="center">
1,118.16</p>
</td>
<td style="width:91px;">
<p align="center">
1,137.38</p>
</td>
<td style="width:91px;">
<p align="center">
1,146.98</p>
</td>
<td style="width:91px;">
<p align="center">
1,166.2</p>
</td>
</tr>
</tbody>
</table>
<p align="center">
</p>
<p>
<strong>Pivot for this month:</strong></p>
<table align="left" border="1" cellpadding="0" cellspacing="0" style="width:658px;" width="658">
<tbody>
<tr>
<td style="width:94px;height:22px;">
<p style="text-align: center;">
<strong>S3</strong></p>
</td>
<td style="width:94px;height:22px;">
<p style="text-align: center;">
<strong>S2</strong></p>
</td>
<td style="width:94px;height:22px;">
<p style="text-align: center;">
<strong>S1</strong></p>
</td>
<td style="width:88px;height:22px;">
<p style="text-align: center;">
<strong>Pivot</strong></p>
</td>
<td style="width:96px;height:22px;">
<p style="text-align: center;">
<strong>R1</strong></p>
</td>
<td style="width:96px;height:22px;">
<p style="text-align: center;">
<strong>R2</strong></p>
</td>
<td style="width:96px;height:22px;">
<p style="text-align: center;">
<strong>R3</strong></p>
</td>
</tr>
<tr>
<td style="width:94px;height:22px;">
<p style="text-align: center;">
<strong>1025.74 </strong></p>
</td>
<td style="width:94px;height:22px;">
<p style="text-align: center;">
<strong>1075.08 </strong></p>
</td>
<td style="width:94px;height:22px;">
<p style="text-align: center;">
<strong>1101.64 </strong></p>
</td>
<td style="width:88px;height:22px;">
<p style="text-align: center;">
<strong>1150.98 </strong></p>
</td>
<td style="width:96px;height:22px;">
<p style="text-align: center;">
<strong>1177.54 </strong></p>
</td>
<td style="width:96px;height:22px;">
<p style="text-align: center;">
<strong>1226.88 </strong></p>
</td>
<td style="width:96px;height:22px;">
<p style="text-align: center;">
<strong>1253.44 </strong></p>
</td>
</tr>
</tbody>
</table>
<p style="text-align: center;">
</p>
<p style="text-align: center;">
</p>
<p style="text-align: center;">
</p>
<p>
<strong>Volume:</strong></p>
<p>
This week: 96.37 crores</p>
<p>
Last week: 79.75 crores</p>
<p align="center">
</p>
<p>
<strong>Projected range for next week: 1,113.36 to 1,142.18</strong></p>
<p>
<strong>OHLC update of 23<sup>rd</sup> Falgun:</strong></p>
<p>
O: 1111.76</p>
<p>
H: 1127.77</p>
<p>
L: 1111.70</p>
<p>
C: 1127.77</p>
<p>
<strong>Pivot table for 26<sup>th</sup> Falgun: </strong></p>
<table border="1" cellpadding="0" cellspacing="0">
<tbody>
<tr>
<td style="width:91px;">
<p align="center">
<strong>S3</strong></p>
</td>
<td style="width:91px;">
<p align="center">
<strong>S2</strong></p>
</td>
<td style="width:91px;">
<p align="center">
<strong>S1</strong></p>
</td>
<td style="width:91px;">
<p align="center">
<strong>Pivot</strong></p>
</td>
<td style="width:91px;">
<p align="center">
<strong>R1</strong></p>
</td>
<td style="width:91px;">
<p align="center">
<strong>R2</strong></p>
</td>
<td style="width:91px;">
<p align="center">
<strong>R3</strong></p>
</td>
</tr>
<tr>
<td style="width:91px;">
<p align="center">
1,100.99</p>
</td>
<td style="width:91px;">
<p align="center">
1,106.34</p>
</td>
<td style="width:91px;">
<p align="center">
1,117.06</p>
</td>
<td style="width:91px;">
<p align="center">
1,122.41</p>
</td>
<td style="width:91px;">
<p align="center">
1,133.13</p>
</td>
<td style="width:91px;">
<p align="center">
1,138.48</p>
</td>
<td style="width:91px;">
<p align="center">
1,149.2</p>
</td>
</tr>
</tbody>
</table>
<p align="center">
</p>
<p>
<strong>Turnover:</strong></p>
<p>
This week (19<sup>th</sup> to 23<sup>rd</sup> Falgun): 96.37 crores</p>
<p>
Last week (12<sup>th</sup> to 16<sup>th</sup> Falgun): 79.75 crores</p>
<p>
23<sup>rd</sup> Falgun: 29.39 crores</p>
<p>
</p>
<p>
<strong>Outlook: </strong></p>
<p>
The CMP of 23<sup>rd</sup> Falgun is 1,127.77 which are above the daily pivot of 1,122.41 as well as above the weekly pivot 1,118.16.</p>
<p>
</p>
<p>
<strong>Sub indices market information: </strong></p>
<ul>
<li>
- Life insurance has increased by 159.32 points in index value.</li>
<li>
- Non life insurance has increased by 105.24 points in index value.</li>
<li>
- Banking has increased by 13.92 points in index value.</li>
</ul>
<p>
</p>
<p>
<img alt="" src="/app/webroot/userfiles/images/Vacancies/march%208%20pic%201.jpg" style="width: 800px; height: 600px;" /></p>
<p>
<strong> Banking candle stick chart</strong></p>
<p style="margin-left:.25in;">
</p>
<p style="margin-left:.25in;">
<strong>The top 5 scrips of banking in turnover are: </strong></p>
<table border="1" cellpadding="0" cellspacing="0">
<tbody>
<tr>
<td style="width:174px;height:22px;">
<p>
<strong>Scrips</strong></p>
</td>
<td style="width:176px;height:22px;">
<p>
<strong>Turnover</strong></p>
</td>
<td style="width:174px;height:22px;">
<p>
<strong>LTP</strong></p>
</td>
</tr>
<tr>
<td style="width:174px;height:22px;">
<p>
NCCB</p>
</td>
<td style="width:176px;height:22px;">
<p>
NRS. 1.282 crores</p>
</td>
<td style="width:174px;height:22px;">
<p>
210</p>
</td>
</tr>
<tr>
<td style="width:174px;height:21px;">
<p>
PRVU</p>
</td>
<td style="width:176px;height:21px;">
<p>
NRS. 1.046 crores</p>
</td>
<td style="width:174px;height:21px;">
<p>
224</p>
</td>
</tr>
<tr>
<td style="width:174px;height:22px;">
<p>
NICA</p>
</td>
<td style="width:176px;height:22px;">
<p>
NRs. 1.035 crores</p>
</td>
<td style="width:174px;height:22px;">
<p>
391</p>
</td>
</tr>
<tr>
<td style="width:174px;height:22px;">
<p>
CBBL</p>
</td>
<td style="width:176px;height:22px;">
<p>
NRs. 0.772 crores</p>
</td>
<td style="width:174px;height:22px;">
<p>
886</p>
</td>
</tr>
<tr>
<td style="width:174px;height:22px;">
<p>
CIT</p>
</td>
<td style="width:176px;height:22px;">
<p>
NRs. 0754 crores</p>
</td>
<td style="width:174px;height:22px;">
<p>
2,563</p>
</td>
</tr>
</tbody>
</table>
<p>
<strong>Conclusion</strong></p>
<p>
It is said that the stock market progressions are always process of anomalous and adventure.</p>
<p>
Sometimes lousy movements, sometimes very disciplined and calculative and sometimes very wild with high motility behaviors.</p>
<p>
For past few weeks markets have shown choppy to down trend Trading courses.</p>
<p>
But this few weeks market has shown a recovery sign both in Index value and volume.</p>
<p>
If we look at past years same months (magh, falgun and chaitra). The market had shown a recovery but only for short time. The market has shown a recovery but only for short time. The difference is the market turnover used to be more than Rs. 100 crores per day during last couple of years, but this time market turnover has been as meager Rs. 20 crores per day in average for long periods. Still, If analysis is to be made on volume side, though with meager, rise market show a sign of recovery with mild reliability.</p>
<p>
</p>
<p>
The support and resistant's on the charts have been distinguished on the charts below.</p>
<p>
</p>
<p>
<img alt="" src="/app/webroot/userfiles/images/Vacancies/march%208%20pic%202.jpg" style="width: 800px; height: 600px;" /></p>
<p>
<strong> NEPSE monthly chart with multiple support and resistant</strong></p>
<p>
</p>
<p>
a) Bearish channel, Strong support at 1064- 1040.</p>
<p>
b) Bullish channel, Strong Resistant at 1183- 1204.</p>
<p>
</p>
<p>
</p>
<p>
<img alt="" src="/app/webroot/userfiles/images/Vacancies/march%208%20pic%203.jpg" style="width: 800px; height: 600px;" /></p>
<p>
<strong> NEPSE weekly candle stick</strong></p>
<p>
a) Inside the bearish channel markets range for next few weeks are as:</p>
<p>
i) Current Market Price (CMP) = 1127.77</p>
<p>
ii) Support: Initial support = 1121.23</p>
<p>
Intermediary support =1098/1096</p>
<p>
Final support = 1065.11</p>
<p>
iii) Resistant: Initial resistant = 1148.81</p>
<p>
Final resistant = 1183.06</p>
<p>
b) Bullish engulfing candle stock pattern with mild reliability.</p>
<p>
</p>
<p>
<img alt="" src="/app/webroot/userfiles/images/Vacancies/march%208%20pic%204.jpg" style="width: 800px; height: 600px;" /></p>
<p>
<strong>Nepse daily candle stick</strong></p>
<p>
</p>
<p>
a) The market has been seemed to increase in its volume and index too.</p>
<p>
b) Some may want to sell and some may want to buy the share.</p>
<p>
c) The most increased points among all was of life insurance.</p>
<p>
</p>
<p>
<strong> Fundamentals:</strong></p>
<p>
1) Next week falgun closing is ahead.</p>
<p>
2) Next month 3rd fiscal quarterly closing starts.</p>
<p>
a) If banks are provided with enough liquidity, the current bullish market would be approved for </p>
<p>
further price gain.</p>
<p>
b) In case the banks are not comfortable with enough liquidity, chaitra 2nd/ 3rd week may face a </p>
<p>
panic sell in market.</p>
<p>
c) Since third quarter is in verge to close, government and its agency seems claiming a robust fiscal</p>
<p>
growth amid various challenges.</p>
<p>
d) The most important factor is, if government is ready to spend the allocated budget in chaitra? or</p>
<p>
will it wait for next month.</p>
<p>
</p>
<p>
</p>
<p>
</p>
<p>
<strong> Happy trading……..!!!!!!!</strong></p>
<p>
</p>
<p>
</p>
',
'published' => true,
'created' => '2019-03-08',
'modified' => '2019-03-08',
'keywords' => '',
'description' => '',
'sortorder' => '9986',
'image' => '20190308062910_march 8 pic 2.jpg',
'article_date' => '2019-03-08 00:00:00',
'homepage' => true,
'breaking_news' => false,
'main_news' => false,
'in_scroller' => false,
'user_id' => '22'
),
'ArticleCategory' => array(
'id' => '1',
'name' => 'NEWS',
'parentOf' => '0',
'published' => true,
'registered' => '2015-07-20 00:00:00',
'sortorder' => '158',
'del_flag' => '0',
'homepage' => true,
'display_in_menu' => true,
'user_id' => '1',
'created' => '0000-00-00 00:00:00',
'modified' => '2018-11-22 11:58:49'
),
'User' => array(
'password' => '*****',
'id' => '22',
'user_detail_id' => '1',
'group_id' => '24',
'username' => 'kishor.bam@newbusinessage.com',
'name' => '',
'email' => 'kishor.bam@newbusinessage.com',
'address' => '',
'gender' => '',
'access' => '1',
'phone' => '',
'access_type' => '0',
'activated' => false,
'sortorder' => '0',
'published' => '0',
'created' => '2018-11-30 10:47:22',
'last_login' => '2019-06-09 10:32:40',
'ip' => '202.63.242.112'
),
'ArticleComment' => array(),
'ArticleFeature' => array(),
'ArticleHasAuthor' => array(),
'ArticleHasTag' => array(),
'ArticleView' => array(
(int) 0 => array(
'article_id' => '10220',
'hit' => '1290'
)
),
'Slider' => array()
)
$current_user = null
$logged_in = false
$image = 'https://www.old.newbusinessage.com/app/webroot/img/news/20190308062910_march 8 pic 2.jpg'
$user = null
$groupId = null
include - APP/View/Articles/view.ctp, line 116
View::_evaluate() - CORE/Cake/View/View.php, line 971
View::_render() - CORE/Cake/View/View.php, line 933
View::render() - CORE/Cake/View/View.php, line 473
Controller::render() - CORE/Cake/Controller/Controller.php, line 968
Dispatcher::_invoke() - CORE/Cake/Routing/Dispatcher.php, line 200
Dispatcher::dispatch() - CORE/Cake/Routing/Dispatcher.php, line 167
[main] - APP/webroot/index.php, line 117
$viewFile = '/var/www/html/newbusinessage.com/app/View/Articles/view.ctp'
$dataForView = array(
'article' => array(
'Article' => array(
'id' => '10220',
'article_category_id' => '1',
'title' => 'Market Watch of March 7',
'sub_title' => '',
'summary' => 'The CMP of 23rd Falgun is 1,127.77 which are above the daily pivot of 1,122.41 as well as above the weekly pivot 1,118.16.',
'content' => '<p>
<strong>Current market price (CMP): </strong><strong>1,127.77</strong></p>
<p>
</p>
<p>
<strong>OHLC update of this week: </strong></p>
<p>
O: 1105.53</p>
<p>
H: 1127.77</p>
<p>
L: 1098.95</p>
<p>
C: 1127.77</p>
<p>
</p>
<p>
<strong>Pivot table for next week (26th to 30th falgun): </strong></p>
<table border="1" cellpadding="0" cellspacing="0">
<tbody>
<tr>
<td style="width:91px;">
<p align="center">
<strong>S3</strong></p>
</td>
<td style="width:91px;">
<p align="center">
<strong>S2</strong></p>
</td>
<td style="width:91px;">
<p align="center">
<strong>S1</strong></p>
</td>
<td style="width:91px;">
<p align="center">
<strong>Pivot</strong></p>
</td>
<td style="width:91px;">
<p align="center">
<strong>R1</strong></p>
</td>
<td style="width:91px;">
<p align="center">
<strong>R2</strong></p>
</td>
<td style="width:91px;">
<p align="center">
<strong>R3</strong></p>
</td>
</tr>
<tr>
<td style="width:91px;">
<p align="center">
1,079.74</p>
</td>
<td style="width:91px;">
<p align="center">
1,089.34</p>
</td>
<td style="width:91px;">
<p align="center">
1,108.56</p>
</td>
<td style="width:91px;">
<p align="center">
1,118.16</p>
</td>
<td style="width:91px;">
<p align="center">
1,137.38</p>
</td>
<td style="width:91px;">
<p align="center">
1,146.98</p>
</td>
<td style="width:91px;">
<p align="center">
1,166.2</p>
</td>
</tr>
</tbody>
</table>
<p align="center">
</p>
<p>
<strong>Pivot for this month:</strong></p>
<table align="left" border="1" cellpadding="0" cellspacing="0" style="width:658px;" width="658">
<tbody>
<tr>
<td style="width:94px;height:22px;">
<p style="text-align: center;">
<strong>S3</strong></p>
</td>
<td style="width:94px;height:22px;">
<p style="text-align: center;">
<strong>S2</strong></p>
</td>
<td style="width:94px;height:22px;">
<p style="text-align: center;">
<strong>S1</strong></p>
</td>
<td style="width:88px;height:22px;">
<p style="text-align: center;">
<strong>Pivot</strong></p>
</td>
<td style="width:96px;height:22px;">
<p style="text-align: center;">
<strong>R1</strong></p>
</td>
<td style="width:96px;height:22px;">
<p style="text-align: center;">
<strong>R2</strong></p>
</td>
<td style="width:96px;height:22px;">
<p style="text-align: center;">
<strong>R3</strong></p>
</td>
</tr>
<tr>
<td style="width:94px;height:22px;">
<p style="text-align: center;">
<strong>1025.74 </strong></p>
</td>
<td style="width:94px;height:22px;">
<p style="text-align: center;">
<strong>1075.08 </strong></p>
</td>
<td style="width:94px;height:22px;">
<p style="text-align: center;">
<strong>1101.64 </strong></p>
</td>
<td style="width:88px;height:22px;">
<p style="text-align: center;">
<strong>1150.98 </strong></p>
</td>
<td style="width:96px;height:22px;">
<p style="text-align: center;">
<strong>1177.54 </strong></p>
</td>
<td style="width:96px;height:22px;">
<p style="text-align: center;">
<strong>1226.88 </strong></p>
</td>
<td style="width:96px;height:22px;">
<p style="text-align: center;">
<strong>1253.44 </strong></p>
</td>
</tr>
</tbody>
</table>
<p style="text-align: center;">
</p>
<p style="text-align: center;">
</p>
<p style="text-align: center;">
</p>
<p>
<strong>Volume:</strong></p>
<p>
This week: 96.37 crores</p>
<p>
Last week: 79.75 crores</p>
<p align="center">
</p>
<p>
<strong>Projected range for next week: 1,113.36 to 1,142.18</strong></p>
<p>
<strong>OHLC update of 23<sup>rd</sup> Falgun:</strong></p>
<p>
O: 1111.76</p>
<p>
H: 1127.77</p>
<p>
L: 1111.70</p>
<p>
C: 1127.77</p>
<p>
<strong>Pivot table for 26<sup>th</sup> Falgun: </strong></p>
<table border="1" cellpadding="0" cellspacing="0">
<tbody>
<tr>
<td style="width:91px;">
<p align="center">
<strong>S3</strong></p>
</td>
<td style="width:91px;">
<p align="center">
<strong>S2</strong></p>
</td>
<td style="width:91px;">
<p align="center">
<strong>S1</strong></p>
</td>
<td style="width:91px;">
<p align="center">
<strong>Pivot</strong></p>
</td>
<td style="width:91px;">
<p align="center">
<strong>R1</strong></p>
</td>
<td style="width:91px;">
<p align="center">
<strong>R2</strong></p>
</td>
<td style="width:91px;">
<p align="center">
<strong>R3</strong></p>
</td>
</tr>
<tr>
<td style="width:91px;">
<p align="center">
1,100.99</p>
</td>
<td style="width:91px;">
<p align="center">
1,106.34</p>
</td>
<td style="width:91px;">
<p align="center">
1,117.06</p>
</td>
<td style="width:91px;">
<p align="center">
1,122.41</p>
</td>
<td style="width:91px;">
<p align="center">
1,133.13</p>
</td>
<td style="width:91px;">
<p align="center">
1,138.48</p>
</td>
<td style="width:91px;">
<p align="center">
1,149.2</p>
</td>
</tr>
</tbody>
</table>
<p align="center">
</p>
<p>
<strong>Turnover:</strong></p>
<p>
This week (19<sup>th</sup> to 23<sup>rd</sup> Falgun): 96.37 crores</p>
<p>
Last week (12<sup>th</sup> to 16<sup>th</sup> Falgun): 79.75 crores</p>
<p>
23<sup>rd</sup> Falgun: 29.39 crores</p>
<p>
</p>
<p>
<strong>Outlook: </strong></p>
<p>
The CMP of 23<sup>rd</sup> Falgun is 1,127.77 which are above the daily pivot of 1,122.41 as well as above the weekly pivot 1,118.16.</p>
<p>
</p>
<p>
<strong>Sub indices market information: </strong></p>
<ul>
<li>
- Life insurance has increased by 159.32 points in index value.</li>
<li>
- Non life insurance has increased by 105.24 points in index value.</li>
<li>
- Banking has increased by 13.92 points in index value.</li>
</ul>
<p>
</p>
<p>
<img alt="" src="/app/webroot/userfiles/images/Vacancies/march%208%20pic%201.jpg" style="width: 800px; height: 600px;" /></p>
<p>
<strong> Banking candle stick chart</strong></p>
<p style="margin-left:.25in;">
</p>
<p style="margin-left:.25in;">
<strong>The top 5 scrips of banking in turnover are: </strong></p>
<table border="1" cellpadding="0" cellspacing="0">
<tbody>
<tr>
<td style="width:174px;height:22px;">
<p>
<strong>Scrips</strong></p>
</td>
<td style="width:176px;height:22px;">
<p>
<strong>Turnover</strong></p>
</td>
<td style="width:174px;height:22px;">
<p>
<strong>LTP</strong></p>
</td>
</tr>
<tr>
<td style="width:174px;height:22px;">
<p>
NCCB</p>
</td>
<td style="width:176px;height:22px;">
<p>
NRS. 1.282 crores</p>
</td>
<td style="width:174px;height:22px;">
<p>
210</p>
</td>
</tr>
<tr>
<td style="width:174px;height:21px;">
<p>
PRVU</p>
</td>
<td style="width:176px;height:21px;">
<p>
NRS. 1.046 crores</p>
</td>
<td style="width:174px;height:21px;">
<p>
224</p>
</td>
</tr>
<tr>
<td style="width:174px;height:22px;">
<p>
NICA</p>
</td>
<td style="width:176px;height:22px;">
<p>
NRs. 1.035 crores</p>
</td>
<td style="width:174px;height:22px;">
<p>
391</p>
</td>
</tr>
<tr>
<td style="width:174px;height:22px;">
<p>
CBBL</p>
</td>
<td style="width:176px;height:22px;">
<p>
NRs. 0.772 crores</p>
</td>
<td style="width:174px;height:22px;">
<p>
886</p>
</td>
</tr>
<tr>
<td style="width:174px;height:22px;">
<p>
CIT</p>
</td>
<td style="width:176px;height:22px;">
<p>
NRs. 0754 crores</p>
</td>
<td style="width:174px;height:22px;">
<p>
2,563</p>
</td>
</tr>
</tbody>
</table>
<p>
<strong>Conclusion</strong></p>
<p>
It is said that the stock market progressions are always process of anomalous and adventure.</p>
<p>
Sometimes lousy movements, sometimes very disciplined and calculative and sometimes very wild with high motility behaviors.</p>
<p>
For past few weeks markets have shown choppy to down trend Trading courses.</p>
<p>
But this few weeks market has shown a recovery sign both in Index value and volume.</p>
<p>
If we look at past years same months (magh, falgun and chaitra). The market had shown a recovery but only for short time. The market has shown a recovery but only for short time. The difference is the market turnover used to be more than Rs. 100 crores per day during last couple of years, but this time market turnover has been as meager Rs. 20 crores per day in average for long periods. Still, If analysis is to be made on volume side, though with meager, rise market show a sign of recovery with mild reliability.</p>
<p>
</p>
<p>
The support and resistant's on the charts have been distinguished on the charts below.</p>
<p>
</p>
<p>
<img alt="" src="/app/webroot/userfiles/images/Vacancies/march%208%20pic%202.jpg" style="width: 800px; height: 600px;" /></p>
<p>
<strong> NEPSE monthly chart with multiple support and resistant</strong></p>
<p>
</p>
<p>
a) Bearish channel, Strong support at 1064- 1040.</p>
<p>
b) Bullish channel, Strong Resistant at 1183- 1204.</p>
<p>
</p>
<p>
</p>
<p>
<img alt="" src="/app/webroot/userfiles/images/Vacancies/march%208%20pic%203.jpg" style="width: 800px; height: 600px;" /></p>
<p>
<strong> NEPSE weekly candle stick</strong></p>
<p>
a) Inside the bearish channel markets range for next few weeks are as:</p>
<p>
i) Current Market Price (CMP) = 1127.77</p>
<p>
ii) Support: Initial support = 1121.23</p>
<p>
Intermediary support =1098/1096</p>
<p>
Final support = 1065.11</p>
<p>
iii) Resistant: Initial resistant = 1148.81</p>
<p>
Final resistant = 1183.06</p>
<p>
b) Bullish engulfing candle stock pattern with mild reliability.</p>
<p>
</p>
<p>
<img alt="" src="/app/webroot/userfiles/images/Vacancies/march%208%20pic%204.jpg" style="width: 800px; height: 600px;" /></p>
<p>
<strong>Nepse daily candle stick</strong></p>
<p>
</p>
<p>
a) The market has been seemed to increase in its volume and index too.</p>
<p>
b) Some may want to sell and some may want to buy the share.</p>
<p>
c) The most increased points among all was of life insurance.</p>
<p>
</p>
<p>
<strong> Fundamentals:</strong></p>
<p>
1) Next week falgun closing is ahead.</p>
<p>
2) Next month 3rd fiscal quarterly closing starts.</p>
<p>
a) If banks are provided with enough liquidity, the current bullish market would be approved for </p>
<p>
further price gain.</p>
<p>
b) In case the banks are not comfortable with enough liquidity, chaitra 2nd/ 3rd week may face a </p>
<p>
panic sell in market.</p>
<p>
c) Since third quarter is in verge to close, government and its agency seems claiming a robust fiscal</p>
<p>
growth amid various challenges.</p>
<p>
d) The most important factor is, if government is ready to spend the allocated budget in chaitra? or</p>
<p>
will it wait for next month.</p>
<p>
</p>
<p>
</p>
<p>
</p>
<p>
<strong> Happy trading……..!!!!!!!</strong></p>
<p>
</p>
<p>
</p>
',
'published' => true,
'created' => '2019-03-08',
'modified' => '2019-03-08',
'keywords' => '',
'description' => '',
'sortorder' => '9986',
'image' => '20190308062910_march 8 pic 2.jpg',
'article_date' => '2019-03-08 00:00:00',
'homepage' => true,
'breaking_news' => false,
'main_news' => false,
'in_scroller' => false,
'user_id' => '22'
),
'ArticleCategory' => array(
'id' => '1',
'name' => 'NEWS',
'parentOf' => '0',
'published' => true,
'registered' => '2015-07-20 00:00:00',
'sortorder' => '158',
'del_flag' => '0',
'homepage' => true,
'display_in_menu' => true,
'user_id' => '1',
'created' => '0000-00-00 00:00:00',
'modified' => '2018-11-22 11:58:49'
),
'User' => array(
'password' => '*****',
'id' => '22',
'user_detail_id' => '1',
'group_id' => '24',
'username' => 'kishor.bam@newbusinessage.com',
'name' => '',
'email' => 'kishor.bam@newbusinessage.com',
'address' => '',
'gender' => '',
'access' => '1',
'phone' => '',
'access_type' => '0',
'activated' => false,
'sortorder' => '0',
'published' => '0',
'created' => '2018-11-30 10:47:22',
'last_login' => '2019-06-09 10:32:40',
'ip' => '202.63.242.112'
),
'ArticleComment' => array(),
'ArticleFeature' => array(),
'ArticleHasAuthor' => array(),
'ArticleHasTag' => array(),
'ArticleView' => array(
(int) 0 => array(
[maximum depth reached]
)
),
'Slider' => array()
),
'current_user' => null,
'logged_in' => false
)
$article = array(
'Article' => array(
'id' => '10220',
'article_category_id' => '1',
'title' => 'Market Watch of March 7',
'sub_title' => '',
'summary' => 'The CMP of 23rd Falgun is 1,127.77 which are above the daily pivot of 1,122.41 as well as above the weekly pivot 1,118.16.',
'content' => '<p>
<strong>Current market price (CMP): </strong><strong>1,127.77</strong></p>
<p>
</p>
<p>
<strong>OHLC update of this week: </strong></p>
<p>
O: 1105.53</p>
<p>
H: 1127.77</p>
<p>
L: 1098.95</p>
<p>
C: 1127.77</p>
<p>
</p>
<p>
<strong>Pivot table for next week (26th to 30th falgun): </strong></p>
<table border="1" cellpadding="0" cellspacing="0">
<tbody>
<tr>
<td style="width:91px;">
<p align="center">
<strong>S3</strong></p>
</td>
<td style="width:91px;">
<p align="center">
<strong>S2</strong></p>
</td>
<td style="width:91px;">
<p align="center">
<strong>S1</strong></p>
</td>
<td style="width:91px;">
<p align="center">
<strong>Pivot</strong></p>
</td>
<td style="width:91px;">
<p align="center">
<strong>R1</strong></p>
</td>
<td style="width:91px;">
<p align="center">
<strong>R2</strong></p>
</td>
<td style="width:91px;">
<p align="center">
<strong>R3</strong></p>
</td>
</tr>
<tr>
<td style="width:91px;">
<p align="center">
1,079.74</p>
</td>
<td style="width:91px;">
<p align="center">
1,089.34</p>
</td>
<td style="width:91px;">
<p align="center">
1,108.56</p>
</td>
<td style="width:91px;">
<p align="center">
1,118.16</p>
</td>
<td style="width:91px;">
<p align="center">
1,137.38</p>
</td>
<td style="width:91px;">
<p align="center">
1,146.98</p>
</td>
<td style="width:91px;">
<p align="center">
1,166.2</p>
</td>
</tr>
</tbody>
</table>
<p align="center">
</p>
<p>
<strong>Pivot for this month:</strong></p>
<table align="left" border="1" cellpadding="0" cellspacing="0" style="width:658px;" width="658">
<tbody>
<tr>
<td style="width:94px;height:22px;">
<p style="text-align: center;">
<strong>S3</strong></p>
</td>
<td style="width:94px;height:22px;">
<p style="text-align: center;">
<strong>S2</strong></p>
</td>
<td style="width:94px;height:22px;">
<p style="text-align: center;">
<strong>S1</strong></p>
</td>
<td style="width:88px;height:22px;">
<p style="text-align: center;">
<strong>Pivot</strong></p>
</td>
<td style="width:96px;height:22px;">
<p style="text-align: center;">
<strong>R1</strong></p>
</td>
<td style="width:96px;height:22px;">
<p style="text-align: center;">
<strong>R2</strong></p>
</td>
<td style="width:96px;height:22px;">
<p style="text-align: center;">
<strong>R3</strong></p>
</td>
</tr>
<tr>
<td style="width:94px;height:22px;">
<p style="text-align: center;">
<strong>1025.74 </strong></p>
</td>
<td style="width:94px;height:22px;">
<p style="text-align: center;">
<strong>1075.08 </strong></p>
</td>
<td style="width:94px;height:22px;">
<p style="text-align: center;">
<strong>1101.64 </strong></p>
</td>
<td style="width:88px;height:22px;">
<p style="text-align: center;">
<strong>1150.98 </strong></p>
</td>
<td style="width:96px;height:22px;">
<p style="text-align: center;">
<strong>1177.54 </strong></p>
</td>
<td style="width:96px;height:22px;">
<p style="text-align: center;">
<strong>1226.88 </strong></p>
</td>
<td style="width:96px;height:22px;">
<p style="text-align: center;">
<strong>1253.44 </strong></p>
</td>
</tr>
</tbody>
</table>
<p style="text-align: center;">
</p>
<p style="text-align: center;">
</p>
<p style="text-align: center;">
</p>
<p>
<strong>Volume:</strong></p>
<p>
This week: 96.37 crores</p>
<p>
Last week: 79.75 crores</p>
<p align="center">
</p>
<p>
<strong>Projected range for next week: 1,113.36 to 1,142.18</strong></p>
<p>
<strong>OHLC update of 23<sup>rd</sup> Falgun:</strong></p>
<p>
O: 1111.76</p>
<p>
H: 1127.77</p>
<p>
L: 1111.70</p>
<p>
C: 1127.77</p>
<p>
<strong>Pivot table for 26<sup>th</sup> Falgun: </strong></p>
<table border="1" cellpadding="0" cellspacing="0">
<tbody>
<tr>
<td style="width:91px;">
<p align="center">
<strong>S3</strong></p>
</td>
<td style="width:91px;">
<p align="center">
<strong>S2</strong></p>
</td>
<td style="width:91px;">
<p align="center">
<strong>S1</strong></p>
</td>
<td style="width:91px;">
<p align="center">
<strong>Pivot</strong></p>
</td>
<td style="width:91px;">
<p align="center">
<strong>R1</strong></p>
</td>
<td style="width:91px;">
<p align="center">
<strong>R2</strong></p>
</td>
<td style="width:91px;">
<p align="center">
<strong>R3</strong></p>
</td>
</tr>
<tr>
<td style="width:91px;">
<p align="center">
1,100.99</p>
</td>
<td style="width:91px;">
<p align="center">
1,106.34</p>
</td>
<td style="width:91px;">
<p align="center">
1,117.06</p>
</td>
<td style="width:91px;">
<p align="center">
1,122.41</p>
</td>
<td style="width:91px;">
<p align="center">
1,133.13</p>
</td>
<td style="width:91px;">
<p align="center">
1,138.48</p>
</td>
<td style="width:91px;">
<p align="center">
1,149.2</p>
</td>
</tr>
</tbody>
</table>
<p align="center">
</p>
<p>
<strong>Turnover:</strong></p>
<p>
This week (19<sup>th</sup> to 23<sup>rd</sup> Falgun): 96.37 crores</p>
<p>
Last week (12<sup>th</sup> to 16<sup>th</sup> Falgun): 79.75 crores</p>
<p>
23<sup>rd</sup> Falgun: 29.39 crores</p>
<p>
</p>
<p>
<strong>Outlook: </strong></p>
<p>
The CMP of 23<sup>rd</sup> Falgun is 1,127.77 which are above the daily pivot of 1,122.41 as well as above the weekly pivot 1,118.16.</p>
<p>
</p>
<p>
<strong>Sub indices market information: </strong></p>
<ul>
<li>
- Life insurance has increased by 159.32 points in index value.</li>
<li>
- Non life insurance has increased by 105.24 points in index value.</li>
<li>
- Banking has increased by 13.92 points in index value.</li>
</ul>
<p>
</p>
<p>
<img alt="" src="/app/webroot/userfiles/images/Vacancies/march%208%20pic%201.jpg" style="width: 800px; height: 600px;" /></p>
<p>
<strong> Banking candle stick chart</strong></p>
<p style="margin-left:.25in;">
</p>
<p style="margin-left:.25in;">
<strong>The top 5 scrips of banking in turnover are: </strong></p>
<table border="1" cellpadding="0" cellspacing="0">
<tbody>
<tr>
<td style="width:174px;height:22px;">
<p>
<strong>Scrips</strong></p>
</td>
<td style="width:176px;height:22px;">
<p>
<strong>Turnover</strong></p>
</td>
<td style="width:174px;height:22px;">
<p>
<strong>LTP</strong></p>
</td>
</tr>
<tr>
<td style="width:174px;height:22px;">
<p>
NCCB</p>
</td>
<td style="width:176px;height:22px;">
<p>
NRS. 1.282 crores</p>
</td>
<td style="width:174px;height:22px;">
<p>
210</p>
</td>
</tr>
<tr>
<td style="width:174px;height:21px;">
<p>
PRVU</p>
</td>
<td style="width:176px;height:21px;">
<p>
NRS. 1.046 crores</p>
</td>
<td style="width:174px;height:21px;">
<p>
224</p>
</td>
</tr>
<tr>
<td style="width:174px;height:22px;">
<p>
NICA</p>
</td>
<td style="width:176px;height:22px;">
<p>
NRs. 1.035 crores</p>
</td>
<td style="width:174px;height:22px;">
<p>
391</p>
</td>
</tr>
<tr>
<td style="width:174px;height:22px;">
<p>
CBBL</p>
</td>
<td style="width:176px;height:22px;">
<p>
NRs. 0.772 crores</p>
</td>
<td style="width:174px;height:22px;">
<p>
886</p>
</td>
</tr>
<tr>
<td style="width:174px;height:22px;">
<p>
CIT</p>
</td>
<td style="width:176px;height:22px;">
<p>
NRs. 0754 crores</p>
</td>
<td style="width:174px;height:22px;">
<p>
2,563</p>
</td>
</tr>
</tbody>
</table>
<p>
<strong>Conclusion</strong></p>
<p>
It is said that the stock market progressions are always process of anomalous and adventure.</p>
<p>
Sometimes lousy movements, sometimes very disciplined and calculative and sometimes very wild with high motility behaviors.</p>
<p>
For past few weeks markets have shown choppy to down trend Trading courses.</p>
<p>
But this few weeks market has shown a recovery sign both in Index value and volume.</p>
<p>
If we look at past years same months (magh, falgun and chaitra). The market had shown a recovery but only for short time. The market has shown a recovery but only for short time. The difference is the market turnover used to be more than Rs. 100 crores per day during last couple of years, but this time market turnover has been as meager Rs. 20 crores per day in average for long periods. Still, If analysis is to be made on volume side, though with meager, rise market show a sign of recovery with mild reliability.</p>
<p>
</p>
<p>
The support and resistant's on the charts have been distinguished on the charts below.</p>
<p>
</p>
<p>
<img alt="" src="/app/webroot/userfiles/images/Vacancies/march%208%20pic%202.jpg" style="width: 800px; height: 600px;" /></p>
<p>
<strong> NEPSE monthly chart with multiple support and resistant</strong></p>
<p>
</p>
<p>
a) Bearish channel, Strong support at 1064- 1040.</p>
<p>
b) Bullish channel, Strong Resistant at 1183- 1204.</p>
<p>
</p>
<p>
</p>
<p>
<img alt="" src="/app/webroot/userfiles/images/Vacancies/march%208%20pic%203.jpg" style="width: 800px; height: 600px;" /></p>
<p>
<strong> NEPSE weekly candle stick</strong></p>
<p>
a) Inside the bearish channel markets range for next few weeks are as:</p>
<p>
i) Current Market Price (CMP) = 1127.77</p>
<p>
ii) Support: Initial support = 1121.23</p>
<p>
Intermediary support =1098/1096</p>
<p>
Final support = 1065.11</p>
<p>
iii) Resistant: Initial resistant = 1148.81</p>
<p>
Final resistant = 1183.06</p>
<p>
b) Bullish engulfing candle stock pattern with mild reliability.</p>
<p>
</p>
<p>
<img alt="" src="/app/webroot/userfiles/images/Vacancies/march%208%20pic%204.jpg" style="width: 800px; height: 600px;" /></p>
<p>
<strong>Nepse daily candle stick</strong></p>
<p>
</p>
<p>
a) The market has been seemed to increase in its volume and index too.</p>
<p>
b) Some may want to sell and some may want to buy the share.</p>
<p>
c) The most increased points among all was of life insurance.</p>
<p>
</p>
<p>
<strong> Fundamentals:</strong></p>
<p>
1) Next week falgun closing is ahead.</p>
<p>
2) Next month 3rd fiscal quarterly closing starts.</p>
<p>
a) If banks are provided with enough liquidity, the current bullish market would be approved for </p>
<p>
further price gain.</p>
<p>
b) In case the banks are not comfortable with enough liquidity, chaitra 2nd/ 3rd week may face a </p>
<p>
panic sell in market.</p>
<p>
c) Since third quarter is in verge to close, government and its agency seems claiming a robust fiscal</p>
<p>
growth amid various challenges.</p>
<p>
d) The most important factor is, if government is ready to spend the allocated budget in chaitra? or</p>
<p>
will it wait for next month.</p>
<p>
</p>
<p>
</p>
<p>
</p>
<p>
<strong> Happy trading……..!!!!!!!</strong></p>
<p>
</p>
<p>
</p>
',
'published' => true,
'created' => '2019-03-08',
'modified' => '2019-03-08',
'keywords' => '',
'description' => '',
'sortorder' => '9986',
'image' => '20190308062910_march 8 pic 2.jpg',
'article_date' => '2019-03-08 00:00:00',
'homepage' => true,
'breaking_news' => false,
'main_news' => false,
'in_scroller' => false,
'user_id' => '22'
),
'ArticleCategory' => array(
'id' => '1',
'name' => 'NEWS',
'parentOf' => '0',
'published' => true,
'registered' => '2015-07-20 00:00:00',
'sortorder' => '158',
'del_flag' => '0',
'homepage' => true,
'display_in_menu' => true,
'user_id' => '1',
'created' => '0000-00-00 00:00:00',
'modified' => '2018-11-22 11:58:49'
),
'User' => array(
'password' => '*****',
'id' => '22',
'user_detail_id' => '1',
'group_id' => '24',
'username' => 'kishor.bam@newbusinessage.com',
'name' => '',
'email' => 'kishor.bam@newbusinessage.com',
'address' => '',
'gender' => '',
'access' => '1',
'phone' => '',
'access_type' => '0',
'activated' => false,
'sortorder' => '0',
'published' => '0',
'created' => '2018-11-30 10:47:22',
'last_login' => '2019-06-09 10:32:40',
'ip' => '202.63.242.112'
),
'ArticleComment' => array(),
'ArticleFeature' => array(),
'ArticleHasAuthor' => array(),
'ArticleHasTag' => array(),
'ArticleView' => array(
(int) 0 => array(
'article_id' => '10220',
'hit' => '1290'
)
),
'Slider' => array()
)
$current_user = null
$logged_in = false
$image = 'https://www.old.newbusinessage.com/app/webroot/img/news/20190308062910_march 8 pic 2.jpg'
$user = null
$groupId = null
$user_id = null
$date = '2019-03-08 00:00:00'
$dateFromDatabase = (int) 1551982500
$newDate = 'Mar 08, 2019'
$articleView = array(
'article_id' => '10220',
'hit' => '1290'
)
$word_count = (int) 1954
$time_to_read = (float) 9.77
$time_to_read_min = (float) 9
$time_to_read_second = (float) 46
include - APP/View/Articles/view.ctp, line 241
View::_evaluate() - CORE/Cake/View/View.php, line 971
View::_render() - CORE/Cake/View/View.php, line 933
View::render() - CORE/Cake/View/View.php, line 473
Controller::render() - CORE/Cake/Controller/Controller.php, line 968
Dispatcher::_invoke() - CORE/Cake/Routing/Dispatcher.php, line 200
Dispatcher::dispatch() - CORE/Cake/Routing/Dispatcher.php, line 167
[main] - APP/webroot/index.php, line 117
Current market price (CMP): 1,127.77
OHLC update of this week:
O: 1105.53
H: 1127.77
L: 1098.95
C: 1127.77
Pivot table for next week (26th to 30th falgun):
S3
S2
S1
Pivot
R1
R2
R3
1,079.74
1,089.34
1,108.56
1,118.16
1,137.38
1,146.98
1,166.2
Pivot for this month:
S3
S2
S1
Pivot
R1
R2
R3
1025.74
1075.08
1101.64
1150.98
1177.54
1226.88
1253.44
Volume:
This week: 96.37 crores
Last week: 79.75 crores
Projected range for next week: 1,113.36 to 1,142.18
OHLC update of 23rd Falgun:
O: 1111.76
H: 1127.77
L: 1111.70
C: 1127.77
Pivot table for 26th Falgun:
S3
S2
S1
Pivot
R1
R2
R3
1,100.99
1,106.34
1,117.06
1,122.41
1,133.13
1,138.48
1,149.2
Turnover:
This week (19th to 23rd Falgun): 96.37 crores
Last week (12th to 16th Falgun): 79.75 crores
23rd Falgun: 29.39 crores
Outlook:
The CMP of 23rd Falgun is 1,127.77 which are above the daily pivot of 1,122.41 as well as above the weekly pivot 1,118.16.
Sub indices market information:
- Life insurance has increased by 159.32 points in index value.
- Non life insurance has increased by 105.24 points in index value.
- Banking has increased by 13.92 points in index value.
Banking candle stick chart
The top 5 scrips of banking in turnover are:
Scrips
Turnover
LTP
NCCB
NRS. 1.282 crores
210
PRVU
NRS. 1.046 crores
224
NICA
NRs. 1.035 crores
391
CBBL
NRs. 0.772 crores
886
CIT
NRs. 0754 crores
2,563
Conclusion
It is said that the stock market progressions are always process of anomalous and adventure.
Sometimes lousy movements, sometimes very disciplined and calculative and sometimes very wild with high motility behaviors.
For past few weeks markets have shown choppy to down trend Trading courses.
But this few weeks market has shown a recovery sign both in Index value and volume.
If we look at past years same months (magh, falgun and chaitra). The market had shown a recovery but only for short time. The market has shown a recovery but only for short time. The difference is the market turnover used to be more than Rs. 100 crores per day during last couple of years, but this time market turnover has been as meager Rs. 20 crores per day in average for long periods. Still, If analysis is to be made on volume side, though with meager, rise market show a sign of recovery with mild reliability.
The support and resistant's on the charts have been distinguished on the charts below.
NEPSE monthly chart with multiple support and resistant
a) Bearish channel, Strong support at 1064- 1040.
b) Bullish channel, Strong Resistant at 1183- 1204.
NEPSE weekly candle stick
a) Inside the bearish channel markets range for next few weeks are as:
i) Current Market Price (CMP) = 1127.77
ii) Support: Initial support = 1121.23
Intermediary support =1098/1096
Final support = 1065.11
iii) Resistant: Initial resistant = 1148.81
Final resistant = 1183.06
b) Bullish engulfing candle stock pattern with mild reliability.
Nepse daily candle stick
a) The market has been seemed to increase in its volume and index too.
b) Some may want to sell and some may want to buy the share.
c) The most increased points among all was of life insurance.
Fundamentals:
1) Next week falgun closing is ahead.
2) Next month 3rd fiscal quarterly closing starts.
a) If banks are provided with enough liquidity, the current bullish market would be approved for
further price gain.
b) In case the banks are not comfortable with enough liquidity, chaitra 2nd/ 3rd week may face a
panic sell in market.
c) Since third quarter is in verge to close, government and its agency seems claiming a robust fiscal
growth amid various challenges.
d) The most important factor is, if government is ready to spend the allocated budget in chaitra? or
FormHelper::create() - CORE/Cake/View/Helper/FormHelper.php, line 383
include - APP/View/Articles/view.ctp, line 273
View::_evaluate() - CORE/Cake/View/View.php, line 971
View::_render() - CORE/Cake/View/View.php, line 933
View::render() - CORE/Cake/View/View.php, line 473
Controller::render() - CORE/Cake/Controller/Controller.php, line 968
Dispatcher::_invoke() - CORE/Cake/Routing/Dispatcher.php, line 200
Dispatcher::dispatch() - CORE/Cake/Routing/Dispatcher.php, line 167
[main] - APP/webroot/index.php, line 117
$viewFile = '/var/www/html/newbusinessage.com/app/View/Elements/side_bar.ctp'
$dataForView = array(
'article' => array(
'Article' => array(
'id' => '10220',
'article_category_id' => '1',
'title' => 'Market Watch of March 7',
'sub_title' => '',
'summary' => 'The CMP of 23rd Falgun is 1,127.77 which are above the daily pivot of 1,122.41 as well as above the weekly pivot 1,118.16.',
'content' => '<p>
<strong>Current market price (CMP): </strong><strong>1,127.77</strong></p>
<p>
</p>
<p>
<strong>OHLC update of this week: </strong></p>
<p>
O: 1105.53</p>
<p>
H: 1127.77</p>
<p>
L: 1098.95</p>
<p>
C: 1127.77</p>
<p>
</p>
<p>
<strong>Pivot table for next week (26th to 30th falgun): </strong></p>
<table border="1" cellpadding="0" cellspacing="0">
<tbody>
<tr>
<td style="width:91px;">
<p align="center">
<strong>S3</strong></p>
</td>
<td style="width:91px;">
<p align="center">
<strong>S2</strong></p>
</td>
<td style="width:91px;">
<p align="center">
<strong>S1</strong></p>
</td>
<td style="width:91px;">
<p align="center">
<strong>Pivot</strong></p>
</td>
<td style="width:91px;">
<p align="center">
<strong>R1</strong></p>
</td>
<td style="width:91px;">
<p align="center">
<strong>R2</strong></p>
</td>
<td style="width:91px;">
<p align="center">
<strong>R3</strong></p>
</td>
</tr>
<tr>
<td style="width:91px;">
<p align="center">
1,079.74</p>
</td>
<td style="width:91px;">
<p align="center">
1,089.34</p>
</td>
<td style="width:91px;">
<p align="center">
1,108.56</p>
</td>
<td style="width:91px;">
<p align="center">
1,118.16</p>
</td>
<td style="width:91px;">
<p align="center">
1,137.38</p>
</td>
<td style="width:91px;">
<p align="center">
1,146.98</p>
</td>
<td style="width:91px;">
<p align="center">
1,166.2</p>
</td>
</tr>
</tbody>
</table>
<p align="center">
</p>
<p>
<strong>Pivot for this month:</strong></p>
<table align="left" border="1" cellpadding="0" cellspacing="0" style="width:658px;" width="658">
<tbody>
<tr>
<td style="width:94px;height:22px;">
<p style="text-align: center;">
<strong>S3</strong></p>
</td>
<td style="width:94px;height:22px;">
<p style="text-align: center;">
<strong>S2</strong></p>
</td>
<td style="width:94px;height:22px;">
<p style="text-align: center;">
<strong>S1</strong></p>
</td>
<td style="width:88px;height:22px;">
<p style="text-align: center;">
<strong>Pivot</strong></p>
</td>
<td style="width:96px;height:22px;">
<p style="text-align: center;">
<strong>R1</strong></p>
</td>
<td style="width:96px;height:22px;">
<p style="text-align: center;">
<strong>R2</strong></p>
</td>
<td style="width:96px;height:22px;">
<p style="text-align: center;">
<strong>R3</strong></p>
</td>
</tr>
<tr>
<td style="width:94px;height:22px;">
<p style="text-align: center;">
<strong>1025.74 </strong></p>
</td>
<td style="width:94px;height:22px;">
<p style="text-align: center;">
<strong>1075.08 </strong></p>
</td>
<td style="width:94px;height:22px;">
<p style="text-align: center;">
<strong>1101.64 </strong></p>
</td>
<td style="width:88px;height:22px;">
<p style="text-align: center;">
<strong>1150.98 </strong></p>
</td>
<td style="width:96px;height:22px;">
<p style="text-align: center;">
<strong>1177.54 </strong></p>
</td>
<td style="width:96px;height:22px;">
<p style="text-align: center;">
<strong>1226.88 </strong></p>
</td>
<td style="width:96px;height:22px;">
<p style="text-align: center;">
<strong>1253.44 </strong></p>
</td>
</tr>
</tbody>
</table>
<p style="text-align: center;">
</p>
<p style="text-align: center;">
</p>
<p style="text-align: center;">
</p>
<p>
<strong>Volume:</strong></p>
<p>
This week: 96.37 crores</p>
<p>
Last week: 79.75 crores</p>
<p align="center">
</p>
<p>
<strong>Projected range for next week: 1,113.36 to 1,142.18</strong></p>
<p>
<strong>OHLC update of 23<sup>rd</sup> Falgun:</strong></p>
<p>
O: 1111.76</p>
<p>
H: 1127.77</p>
<p>
L: 1111.70</p>
<p>
C: 1127.77</p>
<p>
<strong>Pivot table for 26<sup>th</sup> Falgun: </strong></p>
<table border="1" cellpadding="0" cellspacing="0">
<tbody>
<tr>
<td style="width:91px;">
<p align="center">
<strong>S3</strong></p>
</td>
<td style="width:91px;">
<p align="center">
<strong>S2</strong></p>
</td>
<td style="width:91px;">
<p align="center">
<strong>S1</strong></p>
</td>
<td style="width:91px;">
<p align="center">
<strong>Pivot</strong></p>
</td>
<td style="width:91px;">
<p align="center">
<strong>R1</strong></p>
</td>
<td style="width:91px;">
<p align="center">
<strong>R2</strong></p>
</td>
<td style="width:91px;">
<p align="center">
<strong>R3</strong></p>
</td>
</tr>
<tr>
<td style="width:91px;">
<p align="center">
1,100.99</p>
</td>
<td style="width:91px;">
<p align="center">
1,106.34</p>
</td>
<td style="width:91px;">
<p align="center">
1,117.06</p>
</td>
<td style="width:91px;">
<p align="center">
1,122.41</p>
</td>
<td style="width:91px;">
<p align="center">
1,133.13</p>
</td>
<td style="width:91px;">
<p align="center">
1,138.48</p>
</td>
<td style="width:91px;">
<p align="center">
1,149.2</p>
</td>
</tr>
</tbody>
</table>
<p align="center">
</p>
<p>
<strong>Turnover:</strong></p>
<p>
This week (19<sup>th</sup> to 23<sup>rd</sup> Falgun): 96.37 crores</p>
<p>
Last week (12<sup>th</sup> to 16<sup>th</sup> Falgun): 79.75 crores</p>
<p>
23<sup>rd</sup> Falgun: 29.39 crores</p>
<p>
</p>
<p>
<strong>Outlook: </strong></p>
<p>
The CMP of 23<sup>rd</sup> Falgun is 1,127.77 which are above the daily pivot of 1,122.41 as well as above the weekly pivot 1,118.16.</p>
<p>
</p>
<p>
<strong>Sub indices market information: </strong></p>
<ul>
<li>
- Life insurance has increased by 159.32 points in index value.</li>
<li>
- Non life insurance has increased by 105.24 points in index value.</li>
<li>
- Banking has increased by 13.92 points in index value.</li>
</ul>
<p>
</p>
<p>
<img alt="" src="/app/webroot/userfiles/images/Vacancies/march%208%20pic%201.jpg" style="width: 800px; height: 600px;" /></p>
<p>
<strong> Banking candle stick chart</strong></p>
<p style="margin-left:.25in;">
</p>
<p style="margin-left:.25in;">
<strong>The top 5 scrips of banking in turnover are: </strong></p>
<table border="1" cellpadding="0" cellspacing="0">
<tbody>
<tr>
<td style="width:174px;height:22px;">
<p>
<strong>Scrips</strong></p>
</td>
<td style="width:176px;height:22px;">
<p>
<strong>Turnover</strong></p>
</td>
<td style="width:174px;height:22px;">
<p>
<strong>LTP</strong></p>
</td>
</tr>
<tr>
<td style="width:174px;height:22px;">
<p>
NCCB</p>
</td>
<td style="width:176px;height:22px;">
<p>
NRS. 1.282 crores</p>
</td>
<td style="width:174px;height:22px;">
<p>
210</p>
</td>
</tr>
<tr>
<td style="width:174px;height:21px;">
<p>
PRVU</p>
</td>
<td style="width:176px;height:21px;">
<p>
NRS. 1.046 crores</p>
</td>
<td style="width:174px;height:21px;">
<p>
224</p>
</td>
</tr>
<tr>
<td style="width:174px;height:22px;">
<p>
NICA</p>
</td>
<td style="width:176px;height:22px;">
<p>
NRs. 1.035 crores</p>
</td>
<td style="width:174px;height:22px;">
<p>
391</p>
</td>
</tr>
<tr>
<td style="width:174px;height:22px;">
<p>
CBBL</p>
</td>
<td style="width:176px;height:22px;">
<p>
NRs. 0.772 crores</p>
</td>
<td style="width:174px;height:22px;">
<p>
886</p>
</td>
</tr>
<tr>
<td style="width:174px;height:22px;">
<p>
CIT</p>
</td>
<td style="width:176px;height:22px;">
<p>
NRs. 0754 crores</p>
</td>
<td style="width:174px;height:22px;">
<p>
2,563</p>
</td>
</tr>
</tbody>
</table>
<p>
<strong>Conclusion</strong></p>
<p>
It is said that the stock market progressions are always process of anomalous and adventure.</p>
<p>
Sometimes lousy movements, sometimes very disciplined and calculative and sometimes very wild with high motility behaviors.</p>
<p>
For past few weeks markets have shown choppy to down trend Trading courses.</p>
<p>
But this few weeks market has shown a recovery sign both in Index value and volume.</p>
<p>
If we look at past years same months (magh, falgun and chaitra). The market had shown a recovery but only for short time. The market has shown a recovery but only for short time. The difference is the market turnover used to be more than Rs. 100 crores per day during last couple of years, but this time market turnover has been as meager Rs. 20 crores per day in average for long periods. Still, If analysis is to be made on volume side, though with meager, rise market show a sign of recovery with mild reliability.</p>
<p>
</p>
<p>
The support and resistant's on the charts have been distinguished on the charts below.</p>
<p>
</p>
<p>
<img alt="" src="/app/webroot/userfiles/images/Vacancies/march%208%20pic%202.jpg" style="width: 800px; height: 600px;" /></p>
<p>
<strong> NEPSE monthly chart with multiple support and resistant</strong></p>
<p>
</p>
<p>
a) Bearish channel, Strong support at 1064- 1040.</p>
<p>
b) Bullish channel, Strong Resistant at 1183- 1204.</p>
<p>
</p>
<p>
</p>
<p>
<img alt="" src="/app/webroot/userfiles/images/Vacancies/march%208%20pic%203.jpg" style="width: 800px; height: 600px;" /></p>
<p>
<strong> NEPSE weekly candle stick</strong></p>
<p>
a) Inside the bearish channel markets range for next few weeks are as:</p>
<p>
i) Current Market Price (CMP) = 1127.77</p>
<p>
ii) Support: Initial support = 1121.23</p>
<p>
Intermediary support =1098/1096</p>
<p>
Final support = 1065.11</p>
<p>
iii) Resistant: Initial resistant = 1148.81</p>
<p>
Final resistant = 1183.06</p>
<p>
b) Bullish engulfing candle stock pattern with mild reliability.</p>
<p>
</p>
<p>
<img alt="" src="/app/webroot/userfiles/images/Vacancies/march%208%20pic%204.jpg" style="width: 800px; height: 600px;" /></p>
<p>
<strong>Nepse daily candle stick</strong></p>
<p>
</p>
<p>
a) The market has been seemed to increase in its volume and index too.</p>
<p>
b) Some may want to sell and some may want to buy the share.</p>
<p>
c) The most increased points among all was of life insurance.</p>
<p>
</p>
<p>
<strong> Fundamentals:</strong></p>
<p>
1) Next week falgun closing is ahead.</p>
<p>
2) Next month 3rd fiscal quarterly closing starts.</p>
<p>
a) If banks are provided with enough liquidity, the current bullish market would be approved for </p>
<p>
further price gain.</p>
<p>
b) In case the banks are not comfortable with enough liquidity, chaitra 2nd/ 3rd week may face a </p>
<p>
panic sell in market.</p>
<p>
c) Since third quarter is in verge to close, government and its agency seems claiming a robust fiscal</p>
<p>
growth amid various challenges.</p>
<p>
d) The most important factor is, if government is ready to spend the allocated budget in chaitra? or</p>
<p>
will it wait for next month.</p>
<p>
</p>
<p>
</p>
<p>
</p>
<p>
<strong> Happy trading……..!!!!!!!</strong></p>
<p>
</p>
<p>
</p>
',
'published' => true,
'created' => '2019-03-08',
'modified' => '2019-03-08',
'keywords' => '',
'description' => '',
'sortorder' => '9986',
'image' => '20190308062910_march 8 pic 2.jpg',
'article_date' => '2019-03-08 00:00:00',
'homepage' => true,
'breaking_news' => false,
'main_news' => false,
'in_scroller' => false,
'user_id' => '22'
),
'ArticleCategory' => array(
'id' => '1',
'name' => 'NEWS',
'parentOf' => '0',
'published' => true,
'registered' => '2015-07-20 00:00:00',
'sortorder' => '158',
'del_flag' => '0',
'homepage' => true,
'display_in_menu' => true,
'user_id' => '1',
'created' => '0000-00-00 00:00:00',
'modified' => '2018-11-22 11:58:49'
),
'User' => array(
'password' => '*****',
'id' => '22',
'user_detail_id' => '1',
'group_id' => '24',
'username' => 'kishor.bam@newbusinessage.com',
'name' => '',
'email' => 'kishor.bam@newbusinessage.com',
'address' => '',
'gender' => '',
'access' => '1',
'phone' => '',
'access_type' => '0',
'activated' => false,
'sortorder' => '0',
'published' => '0',
'created' => '2018-11-30 10:47:22',
'last_login' => '2019-06-09 10:32:40',
'ip' => '202.63.242.112'
),
'ArticleComment' => array(),
'ArticleFeature' => array(),
'ArticleHasAuthor' => array(),
'ArticleHasTag' => array(),
'ArticleView' => array(
(int) 0 => array(
[maximum depth reached]
)
),
'Slider' => array()
),
'current_user' => null,
'logged_in' => false
)
$article = array(
'Article' => array(
'id' => '10220',
'article_category_id' => '1',
'title' => 'Market Watch of March 7',
'sub_title' => '',
'summary' => 'The CMP of 23rd Falgun is 1,127.77 which are above the daily pivot of 1,122.41 as well as above the weekly pivot 1,118.16.',
'content' => '<p>
<strong>Current market price (CMP): </strong><strong>1,127.77</strong></p>
<p>
</p>
<p>
<strong>OHLC update of this week: </strong></p>
<p>
O: 1105.53</p>
<p>
H: 1127.77</p>
<p>
L: 1098.95</p>
<p>
C: 1127.77</p>
<p>
</p>
<p>
<strong>Pivot table for next week (26th to 30th falgun): </strong></p>
<table border="1" cellpadding="0" cellspacing="0">
<tbody>
<tr>
<td style="width:91px;">
<p align="center">
<strong>S3</strong></p>
</td>
<td style="width:91px;">
<p align="center">
<strong>S2</strong></p>
</td>
<td style="width:91px;">
<p align="center">
<strong>S1</strong></p>
</td>
<td style="width:91px;">
<p align="center">
<strong>Pivot</strong></p>
</td>
<td style="width:91px;">
<p align="center">
<strong>R1</strong></p>
</td>
<td style="width:91px;">
<p align="center">
<strong>R2</strong></p>
</td>
<td style="width:91px;">
<p align="center">
<strong>R3</strong></p>
</td>
</tr>
<tr>
<td style="width:91px;">
<p align="center">
1,079.74</p>
</td>
<td style="width:91px;">
<p align="center">
1,089.34</p>
</td>
<td style="width:91px;">
<p align="center">
1,108.56</p>
</td>
<td style="width:91px;">
<p align="center">
1,118.16</p>
</td>
<td style="width:91px;">
<p align="center">
1,137.38</p>
</td>
<td style="width:91px;">
<p align="center">
1,146.98</p>
</td>
<td style="width:91px;">
<p align="center">
1,166.2</p>
</td>
</tr>
</tbody>
</table>
<p align="center">
</p>
<p>
<strong>Pivot for this month:</strong></p>
<table align="left" border="1" cellpadding="0" cellspacing="0" style="width:658px;" width="658">
<tbody>
<tr>
<td style="width:94px;height:22px;">
<p style="text-align: center;">
<strong>S3</strong></p>
</td>
<td style="width:94px;height:22px;">
<p style="text-align: center;">
<strong>S2</strong></p>
</td>
<td style="width:94px;height:22px;">
<p style="text-align: center;">
<strong>S1</strong></p>
</td>
<td style="width:88px;height:22px;">
<p style="text-align: center;">
<strong>Pivot</strong></p>
</td>
<td style="width:96px;height:22px;">
<p style="text-align: center;">
<strong>R1</strong></p>
</td>
<td style="width:96px;height:22px;">
<p style="text-align: center;">
<strong>R2</strong></p>
</td>
<td style="width:96px;height:22px;">
<p style="text-align: center;">
<strong>R3</strong></p>
</td>
</tr>
<tr>
<td style="width:94px;height:22px;">
<p style="text-align: center;">
<strong>1025.74 </strong></p>
</td>
<td style="width:94px;height:22px;">
<p style="text-align: center;">
<strong>1075.08 </strong></p>
</td>
<td style="width:94px;height:22px;">
<p style="text-align: center;">
<strong>1101.64 </strong></p>
</td>
<td style="width:88px;height:22px;">
<p style="text-align: center;">
<strong>1150.98 </strong></p>
</td>
<td style="width:96px;height:22px;">
<p style="text-align: center;">
<strong>1177.54 </strong></p>
</td>
<td style="width:96px;height:22px;">
<p style="text-align: center;">
<strong>1226.88 </strong></p>
</td>
<td style="width:96px;height:22px;">
<p style="text-align: center;">
<strong>1253.44 </strong></p>
</td>
</tr>
</tbody>
</table>
<p style="text-align: center;">
</p>
<p style="text-align: center;">
</p>
<p style="text-align: center;">
</p>
<p>
<strong>Volume:</strong></p>
<p>
This week: 96.37 crores</p>
<p>
Last week: 79.75 crores</p>
<p align="center">
</p>
<p>
<strong>Projected range for next week: 1,113.36 to 1,142.18</strong></p>
<p>
<strong>OHLC update of 23<sup>rd</sup> Falgun:</strong></p>
<p>
O: 1111.76</p>
<p>
H: 1127.77</p>
<p>
L: 1111.70</p>
<p>
C: 1127.77</p>
<p>
<strong>Pivot table for 26<sup>th</sup> Falgun: </strong></p>
<table border="1" cellpadding="0" cellspacing="0">
<tbody>
<tr>
<td style="width:91px;">
<p align="center">
<strong>S3</strong></p>
</td>
<td style="width:91px;">
<p align="center">
<strong>S2</strong></p>
</td>
<td style="width:91px;">
<p align="center">
<strong>S1</strong></p>
</td>
<td style="width:91px;">
<p align="center">
<strong>Pivot</strong></p>
</td>
<td style="width:91px;">
<p align="center">
<strong>R1</strong></p>
</td>
<td style="width:91px;">
<p align="center">
<strong>R2</strong></p>
</td>
<td style="width:91px;">
<p align="center">
<strong>R3</strong></p>
</td>
</tr>
<tr>
<td style="width:91px;">
<p align="center">
1,100.99</p>
</td>
<td style="width:91px;">
<p align="center">
1,106.34</p>
</td>
<td style="width:91px;">
<p align="center">
1,117.06</p>
</td>
<td style="width:91px;">
<p align="center">
1,122.41</p>
</td>
<td style="width:91px;">
<p align="center">
1,133.13</p>
</td>
<td style="width:91px;">
<p align="center">
1,138.48</p>
</td>
<td style="width:91px;">
<p align="center">
1,149.2</p>
</td>
</tr>
</tbody>
</table>
<p align="center">
</p>
<p>
<strong>Turnover:</strong></p>
<p>
This week (19<sup>th</sup> to 23<sup>rd</sup> Falgun): 96.37 crores</p>
<p>
Last week (12<sup>th</sup> to 16<sup>th</sup> Falgun): 79.75 crores</p>
<p>
23<sup>rd</sup> Falgun: 29.39 crores</p>
<p>
</p>
<p>
<strong>Outlook: </strong></p>
<p>
The CMP of 23<sup>rd</sup> Falgun is 1,127.77 which are above the daily pivot of 1,122.41 as well as above the weekly pivot 1,118.16.</p>
<p>
</p>
<p>
<strong>Sub indices market information: </strong></p>
<ul>
<li>
- Life insurance has increased by 159.32 points in index value.</li>
<li>
- Non life insurance has increased by 105.24 points in index value.</li>
<li>
- Banking has increased by 13.92 points in index value.</li>
</ul>
<p>
</p>
<p>
<img alt="" src="/app/webroot/userfiles/images/Vacancies/march%208%20pic%201.jpg" style="width: 800px; height: 600px;" /></p>
<p>
<strong> Banking candle stick chart</strong></p>
<p style="margin-left:.25in;">
</p>
<p style="margin-left:.25in;">
<strong>The top 5 scrips of banking in turnover are: </strong></p>
<table border="1" cellpadding="0" cellspacing="0">
<tbody>
<tr>
<td style="width:174px;height:22px;">
<p>
<strong>Scrips</strong></p>
</td>
<td style="width:176px;height:22px;">
<p>
<strong>Turnover</strong></p>
</td>
<td style="width:174px;height:22px;">
<p>
<strong>LTP</strong></p>
</td>
</tr>
<tr>
<td style="width:174px;height:22px;">
<p>
NCCB</p>
</td>
<td style="width:176px;height:22px;">
<p>
NRS. 1.282 crores</p>
</td>
<td style="width:174px;height:22px;">
<p>
210</p>
</td>
</tr>
<tr>
<td style="width:174px;height:21px;">
<p>
PRVU</p>
</td>
<td style="width:176px;height:21px;">
<p>
NRS. 1.046 crores</p>
</td>
<td style="width:174px;height:21px;">
<p>
224</p>
</td>
</tr>
<tr>
<td style="width:174px;height:22px;">
<p>
NICA</p>
</td>
<td style="width:176px;height:22px;">
<p>
NRs. 1.035 crores</p>
</td>
<td style="width:174px;height:22px;">
<p>
391</p>
</td>
</tr>
<tr>
<td style="width:174px;height:22px;">
<p>
CBBL</p>
</td>
<td style="width:176px;height:22px;">
<p>
NRs. 0.772 crores</p>
</td>
<td style="width:174px;height:22px;">
<p>
886</p>
</td>
</tr>
<tr>
<td style="width:174px;height:22px;">
<p>
CIT</p>
</td>
<td style="width:176px;height:22px;">
<p>
NRs. 0754 crores</p>
</td>
<td style="width:174px;height:22px;">
<p>
2,563</p>
</td>
</tr>
</tbody>
</table>
<p>
<strong>Conclusion</strong></p>
<p>
It is said that the stock market progressions are always process of anomalous and adventure.</p>
<p>
Sometimes lousy movements, sometimes very disciplined and calculative and sometimes very wild with high motility behaviors.</p>
<p>
For past few weeks markets have shown choppy to down trend Trading courses.</p>
<p>
But this few weeks market has shown a recovery sign both in Index value and volume.</p>
<p>
If we look at past years same months (magh, falgun and chaitra). The market had shown a recovery but only for short time. The market has shown a recovery but only for short time. The difference is the market turnover used to be more than Rs. 100 crores per day during last couple of years, but this time market turnover has been as meager Rs. 20 crores per day in average for long periods. Still, If analysis is to be made on volume side, though with meager, rise market show a sign of recovery with mild reliability.</p>
<p>
</p>
<p>
The support and resistant's on the charts have been distinguished on the charts below.</p>
<p>
</p>
<p>
<img alt="" src="/app/webroot/userfiles/images/Vacancies/march%208%20pic%202.jpg" style="width: 800px; height: 600px;" /></p>
<p>
<strong> NEPSE monthly chart with multiple support and resistant</strong></p>
<p>
</p>
<p>
a) Bearish channel, Strong support at 1064- 1040.</p>
<p>
b) Bullish channel, Strong Resistant at 1183- 1204.</p>
<p>
</p>
<p>
</p>
<p>
<img alt="" src="/app/webroot/userfiles/images/Vacancies/march%208%20pic%203.jpg" style="width: 800px; height: 600px;" /></p>
<p>
<strong> NEPSE weekly candle stick</strong></p>
<p>
a) Inside the bearish channel markets range for next few weeks are as:</p>
<p>
i) Current Market Price (CMP) = 1127.77</p>
<p>
ii) Support: Initial support = 1121.23</p>
<p>
Intermediary support =1098/1096</p>
<p>
Final support = 1065.11</p>
<p>
iii) Resistant: Initial resistant = 1148.81</p>
<p>
Final resistant = 1183.06</p>
<p>
b) Bullish engulfing candle stock pattern with mild reliability.</p>
<p>
</p>
<p>
<img alt="" src="/app/webroot/userfiles/images/Vacancies/march%208%20pic%204.jpg" style="width: 800px; height: 600px;" /></p>
<p>
<strong>Nepse daily candle stick</strong></p>
<p>
</p>
<p>
a) The market has been seemed to increase in its volume and index too.</p>
<p>
b) Some may want to sell and some may want to buy the share.</p>
<p>
c) The most increased points among all was of life insurance.</p>
<p>
</p>
<p>
<strong> Fundamentals:</strong></p>
<p>
1) Next week falgun closing is ahead.</p>
<p>
2) Next month 3rd fiscal quarterly closing starts.</p>
<p>
a) If banks are provided with enough liquidity, the current bullish market would be approved for </p>
<p>
further price gain.</p>
<p>
b) In case the banks are not comfortable with enough liquidity, chaitra 2nd/ 3rd week may face a </p>
<p>
panic sell in market.</p>
<p>
c) Since third quarter is in verge to close, government and its agency seems claiming a robust fiscal</p>
<p>
growth amid various challenges.</p>
<p>
d) The most important factor is, if government is ready to spend the allocated budget in chaitra? or</p>
<p>
will it wait for next month.</p>
<p>
</p>
<p>
</p>
<p>
</p>
<p>
<strong> Happy trading……..!!!!!!!</strong></p>
<p>
</p>
<p>
</p>
',
'published' => true,
'created' => '2019-03-08',
'modified' => '2019-03-08',
'keywords' => '',
'description' => '',
'sortorder' => '9986',
'image' => '20190308062910_march 8 pic 2.jpg',
'article_date' => '2019-03-08 00:00:00',
'homepage' => true,
'breaking_news' => false,
'main_news' => false,
'in_scroller' => false,
'user_id' => '22'
),
'ArticleCategory' => array(
'id' => '1',
'name' => 'NEWS',
'parentOf' => '0',
'published' => true,
'registered' => '2015-07-20 00:00:00',
'sortorder' => '158',
'del_flag' => '0',
'homepage' => true,
'display_in_menu' => true,
'user_id' => '1',
'created' => '0000-00-00 00:00:00',
'modified' => '2018-11-22 11:58:49'
),
'User' => array(
'password' => '*****',
'id' => '22',
'user_detail_id' => '1',
'group_id' => '24',
'username' => 'kishor.bam@newbusinessage.com',
'name' => '',
'email' => 'kishor.bam@newbusinessage.com',
'address' => '',
'gender' => '',
'access' => '1',
'phone' => '',
'access_type' => '0',
'activated' => false,
'sortorder' => '0',
'published' => '0',
'created' => '2018-11-30 10:47:22',
'last_login' => '2019-06-09 10:32:40',
'ip' => '202.63.242.112'
),
'ArticleComment' => array(),
'ArticleFeature' => array(),
'ArticleHasAuthor' => array(),
'ArticleHasTag' => array(),
'ArticleView' => array(
(int) 0 => array(
'article_id' => '10220',
'hit' => '1290'
)
),
'Slider' => array()
)
$current_user = null
$logged_in = false
include - APP/View/Elements/side_bar.ctp, line 60
View::_evaluate() - CORE/Cake/View/View.php, line 971
View::_render() - CORE/Cake/View/View.php, line 933
View::_renderElement() - CORE/Cake/View/View.php, line 1224
View::element() - CORE/Cake/View/View.php, line 418
include - APP/View/Articles/view.ctp, line 391
View::_evaluate() - CORE/Cake/View/View.php, line 971
View::_render() - CORE/Cake/View/View.php, line 933
View::render() - CORE/Cake/View/View.php, line 473
Controller::render() - CORE/Cake/Controller/Controller.php, line 968
Dispatcher::_invoke() - CORE/Cake/Routing/Dispatcher.php, line 200
Dispatcher::dispatch() - CORE/Cake/Routing/Dispatcher.php, line 167
[main] - APP/webroot/index.php, line 117
Warning (2): simplexml_load_file() [<a href='http://php.net/function.simplexml-load-file'>function.simplexml-load-file</a>]: I/O warning : failed to load external entity "" [APP/View/Elements/side_bar.ctp, line 60]
$viewFile = '/var/www/html/newbusinessage.com/app/View/Elements/side_bar.ctp'
$dataForView = array(
'article' => array(
'Article' => array(
'id' => '10220',
'article_category_id' => '1',
'title' => 'Market Watch of March 7',
'sub_title' => '',
'summary' => 'The CMP of 23rd Falgun is 1,127.77 which are above the daily pivot of 1,122.41 as well as above the weekly pivot 1,118.16.',
'content' => '<p>
<strong>Current market price (CMP): </strong><strong>1,127.77</strong></p>
<p>
</p>
<p>
<strong>OHLC update of this week: </strong></p>
<p>
O: 1105.53</p>
<p>
H: 1127.77</p>
<p>
L: 1098.95</p>
<p>
C: 1127.77</p>
<p>
</p>
<p>
<strong>Pivot table for next week (26th to 30th falgun): </strong></p>
<table border="1" cellpadding="0" cellspacing="0">
<tbody>
<tr>
<td style="width:91px;">
<p align="center">
<strong>S3</strong></p>
</td>
<td style="width:91px;">
<p align="center">
<strong>S2</strong></p>
</td>
<td style="width:91px;">
<p align="center">
<strong>S1</strong></p>
</td>
<td style="width:91px;">
<p align="center">
<strong>Pivot</strong></p>
</td>
<td style="width:91px;">
<p align="center">
<strong>R1</strong></p>
</td>
<td style="width:91px;">
<p align="center">
<strong>R2</strong></p>
</td>
<td style="width:91px;">
<p align="center">
<strong>R3</strong></p>
</td>
</tr>
<tr>
<td style="width:91px;">
<p align="center">
1,079.74</p>
</td>
<td style="width:91px;">
<p align="center">
1,089.34</p>
</td>
<td style="width:91px;">
<p align="center">
1,108.56</p>
</td>
<td style="width:91px;">
<p align="center">
1,118.16</p>
</td>
<td style="width:91px;">
<p align="center">
1,137.38</p>
</td>
<td style="width:91px;">
<p align="center">
1,146.98</p>
</td>
<td style="width:91px;">
<p align="center">
1,166.2</p>
</td>
</tr>
</tbody>
</table>
<p align="center">
</p>
<p>
<strong>Pivot for this month:</strong></p>
<table align="left" border="1" cellpadding="0" cellspacing="0" style="width:658px;" width="658">
<tbody>
<tr>
<td style="width:94px;height:22px;">
<p style="text-align: center;">
<strong>S3</strong></p>
</td>
<td style="width:94px;height:22px;">
<p style="text-align: center;">
<strong>S2</strong></p>
</td>
<td style="width:94px;height:22px;">
<p style="text-align: center;">
<strong>S1</strong></p>
</td>
<td style="width:88px;height:22px;">
<p style="text-align: center;">
<strong>Pivot</strong></p>
</td>
<td style="width:96px;height:22px;">
<p style="text-align: center;">
<strong>R1</strong></p>
</td>
<td style="width:96px;height:22px;">
<p style="text-align: center;">
<strong>R2</strong></p>
</td>
<td style="width:96px;height:22px;">
<p style="text-align: center;">
<strong>R3</strong></p>
</td>
</tr>
<tr>
<td style="width:94px;height:22px;">
<p style="text-align: center;">
<strong>1025.74 </strong></p>
</td>
<td style="width:94px;height:22px;">
<p style="text-align: center;">
<strong>1075.08 </strong></p>
</td>
<td style="width:94px;height:22px;">
<p style="text-align: center;">
<strong>1101.64 </strong></p>
</td>
<td style="width:88px;height:22px;">
<p style="text-align: center;">
<strong>1150.98 </strong></p>
</td>
<td style="width:96px;height:22px;">
<p style="text-align: center;">
<strong>1177.54 </strong></p>
</td>
<td style="width:96px;height:22px;">
<p style="text-align: center;">
<strong>1226.88 </strong></p>
</td>
<td style="width:96px;height:22px;">
<p style="text-align: center;">
<strong>1253.44 </strong></p>
</td>
</tr>
</tbody>
</table>
<p style="text-align: center;">
</p>
<p style="text-align: center;">
</p>
<p style="text-align: center;">
</p>
<p>
<strong>Volume:</strong></p>
<p>
This week: 96.37 crores</p>
<p>
Last week: 79.75 crores</p>
<p align="center">
</p>
<p>
<strong>Projected range for next week: 1,113.36 to 1,142.18</strong></p>
<p>
<strong>OHLC update of 23<sup>rd</sup> Falgun:</strong></p>
<p>
O: 1111.76</p>
<p>
H: 1127.77</p>
<p>
L: 1111.70</p>
<p>
C: 1127.77</p>
<p>
<strong>Pivot table for 26<sup>th</sup> Falgun: </strong></p>
<table border="1" cellpadding="0" cellspacing="0">
<tbody>
<tr>
<td style="width:91px;">
<p align="center">
<strong>S3</strong></p>
</td>
<td style="width:91px;">
<p align="center">
<strong>S2</strong></p>
</td>
<td style="width:91px;">
<p align="center">
<strong>S1</strong></p>
</td>
<td style="width:91px;">
<p align="center">
<strong>Pivot</strong></p>
</td>
<td style="width:91px;">
<p align="center">
<strong>R1</strong></p>
</td>
<td style="width:91px;">
<p align="center">
<strong>R2</strong></p>
</td>
<td style="width:91px;">
<p align="center">
<strong>R3</strong></p>
</td>
</tr>
<tr>
<td style="width:91px;">
<p align="center">
1,100.99</p>
</td>
<td style="width:91px;">
<p align="center">
1,106.34</p>
</td>
<td style="width:91px;">
<p align="center">
1,117.06</p>
</td>
<td style="width:91px;">
<p align="center">
1,122.41</p>
</td>
<td style="width:91px;">
<p align="center">
1,133.13</p>
</td>
<td style="width:91px;">
<p align="center">
1,138.48</p>
</td>
<td style="width:91px;">
<p align="center">
1,149.2</p>
</td>
</tr>
</tbody>
</table>
<p align="center">
</p>
<p>
<strong>Turnover:</strong></p>
<p>
This week (19<sup>th</sup> to 23<sup>rd</sup> Falgun): 96.37 crores</p>
<p>
Last week (12<sup>th</sup> to 16<sup>th</sup> Falgun): 79.75 crores</p>
<p>
23<sup>rd</sup> Falgun: 29.39 crores</p>
<p>
</p>
<p>
<strong>Outlook: </strong></p>
<p>
The CMP of 23<sup>rd</sup> Falgun is 1,127.77 which are above the daily pivot of 1,122.41 as well as above the weekly pivot 1,118.16.</p>
<p>
</p>
<p>
<strong>Sub indices market information: </strong></p>
<ul>
<li>
- Life insurance has increased by 159.32 points in index value.</li>
<li>
- Non life insurance has increased by 105.24 points in index value.</li>
<li>
- Banking has increased by 13.92 points in index value.</li>
</ul>
<p>
</p>
<p>
<img alt="" src="/app/webroot/userfiles/images/Vacancies/march%208%20pic%201.jpg" style="width: 800px; height: 600px;" /></p>
<p>
<strong> Banking candle stick chart</strong></p>
<p style="margin-left:.25in;">
</p>
<p style="margin-left:.25in;">
<strong>The top 5 scrips of banking in turnover are: </strong></p>
<table border="1" cellpadding="0" cellspacing="0">
<tbody>
<tr>
<td style="width:174px;height:22px;">
<p>
<strong>Scrips</strong></p>
</td>
<td style="width:176px;height:22px;">
<p>
<strong>Turnover</strong></p>
</td>
<td style="width:174px;height:22px;">
<p>
<strong>LTP</strong></p>
</td>
</tr>
<tr>
<td style="width:174px;height:22px;">
<p>
NCCB</p>
</td>
<td style="width:176px;height:22px;">
<p>
NRS. 1.282 crores</p>
</td>
<td style="width:174px;height:22px;">
<p>
210</p>
</td>
</tr>
<tr>
<td style="width:174px;height:21px;">
<p>
PRVU</p>
</td>
<td style="width:176px;height:21px;">
<p>
NRS. 1.046 crores</p>
</td>
<td style="width:174px;height:21px;">
<p>
224</p>
</td>
</tr>
<tr>
<td style="width:174px;height:22px;">
<p>
NICA</p>
</td>
<td style="width:176px;height:22px;">
<p>
NRs. 1.035 crores</p>
</td>
<td style="width:174px;height:22px;">
<p>
391</p>
</td>
</tr>
<tr>
<td style="width:174px;height:22px;">
<p>
CBBL</p>
</td>
<td style="width:176px;height:22px;">
<p>
NRs. 0.772 crores</p>
</td>
<td style="width:174px;height:22px;">
<p>
886</p>
</td>
</tr>
<tr>
<td style="width:174px;height:22px;">
<p>
CIT</p>
</td>
<td style="width:176px;height:22px;">
<p>
NRs. 0754 crores</p>
</td>
<td style="width:174px;height:22px;">
<p>
2,563</p>
</td>
</tr>
</tbody>
</table>
<p>
<strong>Conclusion</strong></p>
<p>
It is said that the stock market progressions are always process of anomalous and adventure.</p>
<p>
Sometimes lousy movements, sometimes very disciplined and calculative and sometimes very wild with high motility behaviors.</p>
<p>
For past few weeks markets have shown choppy to down trend Trading courses.</p>
<p>
But this few weeks market has shown a recovery sign both in Index value and volume.</p>
<p>
If we look at past years same months (magh, falgun and chaitra). The market had shown a recovery but only for short time. The market has shown a recovery but only for short time. The difference is the market turnover used to be more than Rs. 100 crores per day during last couple of years, but this time market turnover has been as meager Rs. 20 crores per day in average for long periods. Still, If analysis is to be made on volume side, though with meager, rise market show a sign of recovery with mild reliability.</p>
<p>
</p>
<p>
The support and resistant's on the charts have been distinguished on the charts below.</p>
<p>
</p>
<p>
<img alt="" src="/app/webroot/userfiles/images/Vacancies/march%208%20pic%202.jpg" style="width: 800px; height: 600px;" /></p>
<p>
<strong> NEPSE monthly chart with multiple support and resistant</strong></p>
<p>
</p>
<p>
a) Bearish channel, Strong support at 1064- 1040.</p>
<p>
b) Bullish channel, Strong Resistant at 1183- 1204.</p>
<p>
</p>
<p>
</p>
<p>
<img alt="" src="/app/webroot/userfiles/images/Vacancies/march%208%20pic%203.jpg" style="width: 800px; height: 600px;" /></p>
<p>
<strong> NEPSE weekly candle stick</strong></p>
<p>
a) Inside the bearish channel markets range for next few weeks are as:</p>
<p>
i) Current Market Price (CMP) = 1127.77</p>
<p>
ii) Support: Initial support = 1121.23</p>
<p>
Intermediary support =1098/1096</p>
<p>
Final support = 1065.11</p>
<p>
iii) Resistant: Initial resistant = 1148.81</p>
<p>
Final resistant = 1183.06</p>
<p>
b) Bullish engulfing candle stock pattern with mild reliability.</p>
<p>
</p>
<p>
<img alt="" src="/app/webroot/userfiles/images/Vacancies/march%208%20pic%204.jpg" style="width: 800px; height: 600px;" /></p>
<p>
<strong>Nepse daily candle stick</strong></p>
<p>
</p>
<p>
a) The market has been seemed to increase in its volume and index too.</p>
<p>
b) Some may want to sell and some may want to buy the share.</p>
<p>
c) The most increased points among all was of life insurance.</p>
<p>
</p>
<p>
<strong> Fundamentals:</strong></p>
<p>
1) Next week falgun closing is ahead.</p>
<p>
2) Next month 3rd fiscal quarterly closing starts.</p>
<p>
a) If banks are provided with enough liquidity, the current bullish market would be approved for </p>
<p>
further price gain.</p>
<p>
b) In case the banks are not comfortable with enough liquidity, chaitra 2nd/ 3rd week may face a </p>
<p>
panic sell in market.</p>
<p>
c) Since third quarter is in verge to close, government and its agency seems claiming a robust fiscal</p>
<p>
growth amid various challenges.</p>
<p>
d) The most important factor is, if government is ready to spend the allocated budget in chaitra? or</p>
<p>
will it wait for next month.</p>
<p>
</p>
<p>
</p>
<p>
</p>
<p>
<strong> Happy trading……..!!!!!!!</strong></p>
<p>
</p>
<p>
</p>
',
'published' => true,
'created' => '2019-03-08',
'modified' => '2019-03-08',
'keywords' => '',
'description' => '',
'sortorder' => '9986',
'image' => '20190308062910_march 8 pic 2.jpg',
'article_date' => '2019-03-08 00:00:00',
'homepage' => true,
'breaking_news' => false,
'main_news' => false,
'in_scroller' => false,
'user_id' => '22'
),
'ArticleCategory' => array(
'id' => '1',
'name' => 'NEWS',
'parentOf' => '0',
'published' => true,
'registered' => '2015-07-20 00:00:00',
'sortorder' => '158',
'del_flag' => '0',
'homepage' => true,
'display_in_menu' => true,
'user_id' => '1',
'created' => '0000-00-00 00:00:00',
'modified' => '2018-11-22 11:58:49'
),
'User' => array(
'password' => '*****',
'id' => '22',
'user_detail_id' => '1',
'group_id' => '24',
'username' => 'kishor.bam@newbusinessage.com',
'name' => '',
'email' => 'kishor.bam@newbusinessage.com',
'address' => '',
'gender' => '',
'access' => '1',
'phone' => '',
'access_type' => '0',
'activated' => false,
'sortorder' => '0',
'published' => '0',
'created' => '2018-11-30 10:47:22',
'last_login' => '2019-06-09 10:32:40',
'ip' => '202.63.242.112'
),
'ArticleComment' => array(),
'ArticleFeature' => array(),
'ArticleHasAuthor' => array(),
'ArticleHasTag' => array(),
'ArticleView' => array(
(int) 0 => array(
[maximum depth reached]
)
),
'Slider' => array()
),
'current_user' => null,
'logged_in' => false
)
$article = array(
'Article' => array(
'id' => '10220',
'article_category_id' => '1',
'title' => 'Market Watch of March 7',
'sub_title' => '',
'summary' => 'The CMP of 23rd Falgun is 1,127.77 which are above the daily pivot of 1,122.41 as well as above the weekly pivot 1,118.16.',
'content' => '<p>
<strong>Current market price (CMP): </strong><strong>1,127.77</strong></p>
<p>
</p>
<p>
<strong>OHLC update of this week: </strong></p>
<p>
O: 1105.53</p>
<p>
H: 1127.77</p>
<p>
L: 1098.95</p>
<p>
C: 1127.77</p>
<p>
</p>
<p>
<strong>Pivot table for next week (26th to 30th falgun): </strong></p>
<table border="1" cellpadding="0" cellspacing="0">
<tbody>
<tr>
<td style="width:91px;">
<p align="center">
<strong>S3</strong></p>
</td>
<td style="width:91px;">
<p align="center">
<strong>S2</strong></p>
</td>
<td style="width:91px;">
<p align="center">
<strong>S1</strong></p>
</td>
<td style="width:91px;">
<p align="center">
<strong>Pivot</strong></p>
</td>
<td style="width:91px;">
<p align="center">
<strong>R1</strong></p>
</td>
<td style="width:91px;">
<p align="center">
<strong>R2</strong></p>
</td>
<td style="width:91px;">
<p align="center">
<strong>R3</strong></p>
</td>
</tr>
<tr>
<td style="width:91px;">
<p align="center">
1,079.74</p>
</td>
<td style="width:91px;">
<p align="center">
1,089.34</p>
</td>
<td style="width:91px;">
<p align="center">
1,108.56</p>
</td>
<td style="width:91px;">
<p align="center">
1,118.16</p>
</td>
<td style="width:91px;">
<p align="center">
1,137.38</p>
</td>
<td style="width:91px;">
<p align="center">
1,146.98</p>
</td>
<td style="width:91px;">
<p align="center">
1,166.2</p>
</td>
</tr>
</tbody>
</table>
<p align="center">
</p>
<p>
<strong>Pivot for this month:</strong></p>
<table align="left" border="1" cellpadding="0" cellspacing="0" style="width:658px;" width="658">
<tbody>
<tr>
<td style="width:94px;height:22px;">
<p style="text-align: center;">
<strong>S3</strong></p>
</td>
<td style="width:94px;height:22px;">
<p style="text-align: center;">
<strong>S2</strong></p>
</td>
<td style="width:94px;height:22px;">
<p style="text-align: center;">
<strong>S1</strong></p>
</td>
<td style="width:88px;height:22px;">
<p style="text-align: center;">
<strong>Pivot</strong></p>
</td>
<td style="width:96px;height:22px;">
<p style="text-align: center;">
<strong>R1</strong></p>
</td>
<td style="width:96px;height:22px;">
<p style="text-align: center;">
<strong>R2</strong></p>
</td>
<td style="width:96px;height:22px;">
<p style="text-align: center;">
<strong>R3</strong></p>
</td>
</tr>
<tr>
<td style="width:94px;height:22px;">
<p style="text-align: center;">
<strong>1025.74 </strong></p>
</td>
<td style="width:94px;height:22px;">
<p style="text-align: center;">
<strong>1075.08 </strong></p>
</td>
<td style="width:94px;height:22px;">
<p style="text-align: center;">
<strong>1101.64 </strong></p>
</td>
<td style="width:88px;height:22px;">
<p style="text-align: center;">
<strong>1150.98 </strong></p>
</td>
<td style="width:96px;height:22px;">
<p style="text-align: center;">
<strong>1177.54 </strong></p>
</td>
<td style="width:96px;height:22px;">
<p style="text-align: center;">
<strong>1226.88 </strong></p>
</td>
<td style="width:96px;height:22px;">
<p style="text-align: center;">
<strong>1253.44 </strong></p>
</td>
</tr>
</tbody>
</table>
<p style="text-align: center;">
</p>
<p style="text-align: center;">
</p>
<p style="text-align: center;">
</p>
<p>
<strong>Volume:</strong></p>
<p>
This week: 96.37 crores</p>
<p>
Last week: 79.75 crores</p>
<p align="center">
</p>
<p>
<strong>Projected range for next week: 1,113.36 to 1,142.18</strong></p>
<p>
<strong>OHLC update of 23<sup>rd</sup> Falgun:</strong></p>
<p>
O: 1111.76</p>
<p>
H: 1127.77</p>
<p>
L: 1111.70</p>
<p>
C: 1127.77</p>
<p>
<strong>Pivot table for 26<sup>th</sup> Falgun: </strong></p>
<table border="1" cellpadding="0" cellspacing="0">
<tbody>
<tr>
<td style="width:91px;">
<p align="center">
<strong>S3</strong></p>
</td>
<td style="width:91px;">
<p align="center">
<strong>S2</strong></p>
</td>
<td style="width:91px;">
<p align="center">
<strong>S1</strong></p>
</td>
<td style="width:91px;">
<p align="center">
<strong>Pivot</strong></p>
</td>
<td style="width:91px;">
<p align="center">
<strong>R1</strong></p>
</td>
<td style="width:91px;">
<p align="center">
<strong>R2</strong></p>
</td>
<td style="width:91px;">
<p align="center">
<strong>R3</strong></p>
</td>
</tr>
<tr>
<td style="width:91px;">
<p align="center">
1,100.99</p>
</td>
<td style="width:91px;">
<p align="center">
1,106.34</p>
</td>
<td style="width:91px;">
<p align="center">
1,117.06</p>
</td>
<td style="width:91px;">
<p align="center">
1,122.41</p>
</td>
<td style="width:91px;">
<p align="center">
1,133.13</p>
</td>
<td style="width:91px;">
<p align="center">
1,138.48</p>
</td>
<td style="width:91px;">
<p align="center">
1,149.2</p>
</td>
</tr>
</tbody>
</table>
<p align="center">
</p>
<p>
<strong>Turnover:</strong></p>
<p>
This week (19<sup>th</sup> to 23<sup>rd</sup> Falgun): 96.37 crores</p>
<p>
Last week (12<sup>th</sup> to 16<sup>th</sup> Falgun): 79.75 crores</p>
<p>
23<sup>rd</sup> Falgun: 29.39 crores</p>
<p>
</p>
<p>
<strong>Outlook: </strong></p>
<p>
The CMP of 23<sup>rd</sup> Falgun is 1,127.77 which are above the daily pivot of 1,122.41 as well as above the weekly pivot 1,118.16.</p>
<p>
</p>
<p>
<strong>Sub indices market information: </strong></p>
<ul>
<li>
- Life insurance has increased by 159.32 points in index value.</li>
<li>
- Non life insurance has increased by 105.24 points in index value.</li>
<li>
- Banking has increased by 13.92 points in index value.</li>
</ul>
<p>
</p>
<p>
<img alt="" src="/app/webroot/userfiles/images/Vacancies/march%208%20pic%201.jpg" style="width: 800px; height: 600px;" /></p>
<p>
<strong> Banking candle stick chart</strong></p>
<p style="margin-left:.25in;">
</p>
<p style="margin-left:.25in;">
<strong>The top 5 scrips of banking in turnover are: </strong></p>
<table border="1" cellpadding="0" cellspacing="0">
<tbody>
<tr>
<td style="width:174px;height:22px;">
<p>
<strong>Scrips</strong></p>
</td>
<td style="width:176px;height:22px;">
<p>
<strong>Turnover</strong></p>
</td>
<td style="width:174px;height:22px;">
<p>
<strong>LTP</strong></p>
</td>
</tr>
<tr>
<td style="width:174px;height:22px;">
<p>
NCCB</p>
</td>
<td style="width:176px;height:22px;">
<p>
NRS. 1.282 crores</p>
</td>
<td style="width:174px;height:22px;">
<p>
210</p>
</td>
</tr>
<tr>
<td style="width:174px;height:21px;">
<p>
PRVU</p>
</td>
<td style="width:176px;height:21px;">
<p>
NRS. 1.046 crores</p>
</td>
<td style="width:174px;height:21px;">
<p>
224</p>
</td>
</tr>
<tr>
<td style="width:174px;height:22px;">
<p>
NICA</p>
</td>
<td style="width:176px;height:22px;">
<p>
NRs. 1.035 crores</p>
</td>
<td style="width:174px;height:22px;">
<p>
391</p>
</td>
</tr>
<tr>
<td style="width:174px;height:22px;">
<p>
CBBL</p>
</td>
<td style="width:176px;height:22px;">
<p>
NRs. 0.772 crores</p>
</td>
<td style="width:174px;height:22px;">
<p>
886</p>
</td>
</tr>
<tr>
<td style="width:174px;height:22px;">
<p>
CIT</p>
</td>
<td style="width:176px;height:22px;">
<p>
NRs. 0754 crores</p>
</td>
<td style="width:174px;height:22px;">
<p>
2,563</p>
</td>
</tr>
</tbody>
</table>
<p>
<strong>Conclusion</strong></p>
<p>
It is said that the stock market progressions are always process of anomalous and adventure.</p>
<p>
Sometimes lousy movements, sometimes very disciplined and calculative and sometimes very wild with high motility behaviors.</p>
<p>
For past few weeks markets have shown choppy to down trend Trading courses.</p>
<p>
But this few weeks market has shown a recovery sign both in Index value and volume.</p>
<p>
If we look at past years same months (magh, falgun and chaitra). The market had shown a recovery but only for short time. The market has shown a recovery but only for short time. The difference is the market turnover used to be more than Rs. 100 crores per day during last couple of years, but this time market turnover has been as meager Rs. 20 crores per day in average for long periods. Still, If analysis is to be made on volume side, though with meager, rise market show a sign of recovery with mild reliability.</p>
<p>
</p>
<p>
The support and resistant's on the charts have been distinguished on the charts below.</p>
<p>
</p>
<p>
<img alt="" src="/app/webroot/userfiles/images/Vacancies/march%208%20pic%202.jpg" style="width: 800px; height: 600px;" /></p>
<p>
<strong> NEPSE monthly chart with multiple support and resistant</strong></p>
<p>
</p>
<p>
a) Bearish channel, Strong support at 1064- 1040.</p>
<p>
b) Bullish channel, Strong Resistant at 1183- 1204.</p>
<p>
</p>
<p>
</p>
<p>
<img alt="" src="/app/webroot/userfiles/images/Vacancies/march%208%20pic%203.jpg" style="width: 800px; height: 600px;" /></p>
<p>
<strong> NEPSE weekly candle stick</strong></p>
<p>
a) Inside the bearish channel markets range for next few weeks are as:</p>
<p>
i) Current Market Price (CMP) = 1127.77</p>
<p>
ii) Support: Initial support = 1121.23</p>
<p>
Intermediary support =1098/1096</p>
<p>
Final support = 1065.11</p>
<p>
iii) Resistant: Initial resistant = 1148.81</p>
<p>
Final resistant = 1183.06</p>
<p>
b) Bullish engulfing candle stock pattern with mild reliability.</p>
<p>
</p>
<p>
<img alt="" src="/app/webroot/userfiles/images/Vacancies/march%208%20pic%204.jpg" style="width: 800px; height: 600px;" /></p>
<p>
<strong>Nepse daily candle stick</strong></p>
<p>
</p>
<p>
a) The market has been seemed to increase in its volume and index too.</p>
<p>
b) Some may want to sell and some may want to buy the share.</p>
<p>
c) The most increased points among all was of life insurance.</p>
<p>
</p>
<p>
<strong> Fundamentals:</strong></p>
<p>
1) Next week falgun closing is ahead.</p>
<p>
2) Next month 3rd fiscal quarterly closing starts.</p>
<p>
a) If banks are provided with enough liquidity, the current bullish market would be approved for </p>
<p>
further price gain.</p>
<p>
b) In case the banks are not comfortable with enough liquidity, chaitra 2nd/ 3rd week may face a </p>
<p>
panic sell in market.</p>
<p>
c) Since third quarter is in verge to close, government and its agency seems claiming a robust fiscal</p>
<p>
growth amid various challenges.</p>
<p>
d) The most important factor is, if government is ready to spend the allocated budget in chaitra? or</p>
<p>
will it wait for next month.</p>
<p>
</p>
<p>
</p>
<p>
</p>
<p>
<strong> Happy trading……..!!!!!!!</strong></p>
<p>
</p>
<p>
</p>
',
'published' => true,
'created' => '2019-03-08',
'modified' => '2019-03-08',
'keywords' => '',
'description' => '',
'sortorder' => '9986',
'image' => '20190308062910_march 8 pic 2.jpg',
'article_date' => '2019-03-08 00:00:00',
'homepage' => true,
'breaking_news' => false,
'main_news' => false,
'in_scroller' => false,
'user_id' => '22'
),
'ArticleCategory' => array(
'id' => '1',
'name' => 'NEWS',
'parentOf' => '0',
'published' => true,
'registered' => '2015-07-20 00:00:00',
'sortorder' => '158',
'del_flag' => '0',
'homepage' => true,
'display_in_menu' => true,
'user_id' => '1',
'created' => '0000-00-00 00:00:00',
'modified' => '2018-11-22 11:58:49'
),
'User' => array(
'password' => '*****',
'id' => '22',
'user_detail_id' => '1',
'group_id' => '24',
'username' => 'kishor.bam@newbusinessage.com',
'name' => '',
'email' => 'kishor.bam@newbusinessage.com',
'address' => '',
'gender' => '',
'access' => '1',
'phone' => '',
'access_type' => '0',
'activated' => false,
'sortorder' => '0',
'published' => '0',
'created' => '2018-11-30 10:47:22',
'last_login' => '2019-06-09 10:32:40',
'ip' => '202.63.242.112'
),
'ArticleComment' => array(),
'ArticleFeature' => array(),
'ArticleHasAuthor' => array(),
'ArticleHasTag' => array(),
'ArticleView' => array(
(int) 0 => array(
'article_id' => '10220',
'hit' => '1290'
)
),
'Slider' => array()
)
$current_user = null
$logged_in = false
simplexml_load_file - [internal], line ??
include - APP/View/Elements/side_bar.ctp, line 60
View::_evaluate() - CORE/Cake/View/View.php, line 971
View::_render() - CORE/Cake/View/View.php, line 933
View::_renderElement() - CORE/Cake/View/View.php, line 1224
View::element() - CORE/Cake/View/View.php, line 418
include - APP/View/Articles/view.ctp, line 391
View::_evaluate() - CORE/Cake/View/View.php, line 971
View::_render() - CORE/Cake/View/View.php, line 933
View::render() - CORE/Cake/View/View.php, line 473
Controller::render() - CORE/Cake/Controller/Controller.php, line 968
Dispatcher::_invoke() - CORE/Cake/Routing/Dispatcher.php, line 200
Dispatcher::dispatch() - CORE/Cake/Routing/Dispatcher.php, line 167
[main] - APP/webroot/index.php, line 117
file not found!
Notice (8): Undefined variable: file [APP/View/Elements/side_bar.ctp, line 133]
$viewFile = '/var/www/html/newbusinessage.com/app/View/Elements/side_bar.ctp'
$dataForView = array(
'article' => array(
'Article' => array(
'id' => '10220',
'article_category_id' => '1',
'title' => 'Market Watch of March 7',
'sub_title' => '',
'summary' => 'The CMP of 23rd Falgun is 1,127.77 which are above the daily pivot of 1,122.41 as well as above the weekly pivot 1,118.16.',
'content' => '<p>
<strong>Current market price (CMP): </strong><strong>1,127.77</strong></p>
<p>
</p>
<p>
<strong>OHLC update of this week: </strong></p>
<p>
O: 1105.53</p>
<p>
H: 1127.77</p>
<p>
L: 1098.95</p>
<p>
C: 1127.77</p>
<p>
</p>
<p>
<strong>Pivot table for next week (26th to 30th falgun): </strong></p>
<table border="1" cellpadding="0" cellspacing="0">
<tbody>
<tr>
<td style="width:91px;">
<p align="center">
<strong>S3</strong></p>
</td>
<td style="width:91px;">
<p align="center">
<strong>S2</strong></p>
</td>
<td style="width:91px;">
<p align="center">
<strong>S1</strong></p>
</td>
<td style="width:91px;">
<p align="center">
<strong>Pivot</strong></p>
</td>
<td style="width:91px;">
<p align="center">
<strong>R1</strong></p>
</td>
<td style="width:91px;">
<p align="center">
<strong>R2</strong></p>
</td>
<td style="width:91px;">
<p align="center">
<strong>R3</strong></p>
</td>
</tr>
<tr>
<td style="width:91px;">
<p align="center">
1,079.74</p>
</td>
<td style="width:91px;">
<p align="center">
1,089.34</p>
</td>
<td style="width:91px;">
<p align="center">
1,108.56</p>
</td>
<td style="width:91px;">
<p align="center">
1,118.16</p>
</td>
<td style="width:91px;">
<p align="center">
1,137.38</p>
</td>
<td style="width:91px;">
<p align="center">
1,146.98</p>
</td>
<td style="width:91px;">
<p align="center">
1,166.2</p>
</td>
</tr>
</tbody>
</table>
<p align="center">
</p>
<p>
<strong>Pivot for this month:</strong></p>
<table align="left" border="1" cellpadding="0" cellspacing="0" style="width:658px;" width="658">
<tbody>
<tr>
<td style="width:94px;height:22px;">
<p style="text-align: center;">
<strong>S3</strong></p>
</td>
<td style="width:94px;height:22px;">
<p style="text-align: center;">
<strong>S2</strong></p>
</td>
<td style="width:94px;height:22px;">
<p style="text-align: center;">
<strong>S1</strong></p>
</td>
<td style="width:88px;height:22px;">
<p style="text-align: center;">
<strong>Pivot</strong></p>
</td>
<td style="width:96px;height:22px;">
<p style="text-align: center;">
<strong>R1</strong></p>
</td>
<td style="width:96px;height:22px;">
<p style="text-align: center;">
<strong>R2</strong></p>
</td>
<td style="width:96px;height:22px;">
<p style="text-align: center;">
<strong>R3</strong></p>
</td>
</tr>
<tr>
<td style="width:94px;height:22px;">
<p style="text-align: center;">
<strong>1025.74 </strong></p>
</td>
<td style="width:94px;height:22px;">
<p style="text-align: center;">
<strong>1075.08 </strong></p>
</td>
<td style="width:94px;height:22px;">
<p style="text-align: center;">
<strong>1101.64 </strong></p>
</td>
<td style="width:88px;height:22px;">
<p style="text-align: center;">
<strong>1150.98 </strong></p>
</td>
<td style="width:96px;height:22px;">
<p style="text-align: center;">
<strong>1177.54 </strong></p>
</td>
<td style="width:96px;height:22px;">
<p style="text-align: center;">
<strong>1226.88 </strong></p>
</td>
<td style="width:96px;height:22px;">
<p style="text-align: center;">
<strong>1253.44 </strong></p>
</td>
</tr>
</tbody>
</table>
<p style="text-align: center;">
</p>
<p style="text-align: center;">
</p>
<p style="text-align: center;">
</p>
<p>
<strong>Volume:</strong></p>
<p>
This week: 96.37 crores</p>
<p>
Last week: 79.75 crores</p>
<p align="center">
</p>
<p>
<strong>Projected range for next week: 1,113.36 to 1,142.18</strong></p>
<p>
<strong>OHLC update of 23<sup>rd</sup> Falgun:</strong></p>
<p>
O: 1111.76</p>
<p>
H: 1127.77</p>
<p>
L: 1111.70</p>
<p>
C: 1127.77</p>
<p>
<strong>Pivot table for 26<sup>th</sup> Falgun: </strong></p>
<table border="1" cellpadding="0" cellspacing="0">
<tbody>
<tr>
<td style="width:91px;">
<p align="center">
<strong>S3</strong></p>
</td>
<td style="width:91px;">
<p align="center">
<strong>S2</strong></p>
</td>
<td style="width:91px;">
<p align="center">
<strong>S1</strong></p>
</td>
<td style="width:91px;">
<p align="center">
<strong>Pivot</strong></p>
</td>
<td style="width:91px;">
<p align="center">
<strong>R1</strong></p>
</td>
<td style="width:91px;">
<p align="center">
<strong>R2</strong></p>
</td>
<td style="width:91px;">
<p align="center">
<strong>R3</strong></p>
</td>
</tr>
<tr>
<td style="width:91px;">
<p align="center">
1,100.99</p>
</td>
<td style="width:91px;">
<p align="center">
1,106.34</p>
</td>
<td style="width:91px;">
<p align="center">
1,117.06</p>
</td>
<td style="width:91px;">
<p align="center">
1,122.41</p>
</td>
<td style="width:91px;">
<p align="center">
1,133.13</p>
</td>
<td style="width:91px;">
<p align="center">
1,138.48</p>
</td>
<td style="width:91px;">
<p align="center">
1,149.2</p>
</td>
</tr>
</tbody>
</table>
<p align="center">
</p>
<p>
<strong>Turnover:</strong></p>
<p>
This week (19<sup>th</sup> to 23<sup>rd</sup> Falgun): 96.37 crores</p>
<p>
Last week (12<sup>th</sup> to 16<sup>th</sup> Falgun): 79.75 crores</p>
<p>
23<sup>rd</sup> Falgun: 29.39 crores</p>
<p>
</p>
<p>
<strong>Outlook: </strong></p>
<p>
The CMP of 23<sup>rd</sup> Falgun is 1,127.77 which are above the daily pivot of 1,122.41 as well as above the weekly pivot 1,118.16.</p>
<p>
</p>
<p>
<strong>Sub indices market information: </strong></p>
<ul>
<li>
- Life insurance has increased by 159.32 points in index value.</li>
<li>
- Non life insurance has increased by 105.24 points in index value.</li>
<li>
- Banking has increased by 13.92 points in index value.</li>
</ul>
<p>
</p>
<p>
<img alt="" src="/app/webroot/userfiles/images/Vacancies/march%208%20pic%201.jpg" style="width: 800px; height: 600px;" /></p>
<p>
<strong> Banking candle stick chart</strong></p>
<p style="margin-left:.25in;">
</p>
<p style="margin-left:.25in;">
<strong>The top 5 scrips of banking in turnover are: </strong></p>
<table border="1" cellpadding="0" cellspacing="0">
<tbody>
<tr>
<td style="width:174px;height:22px;">
<p>
<strong>Scrips</strong></p>
</td>
<td style="width:176px;height:22px;">
<p>
<strong>Turnover</strong></p>
</td>
<td style="width:174px;height:22px;">
<p>
<strong>LTP</strong></p>
</td>
</tr>
<tr>
<td style="width:174px;height:22px;">
<p>
NCCB</p>
</td>
<td style="width:176px;height:22px;">
<p>
NRS. 1.282 crores</p>
</td>
<td style="width:174px;height:22px;">
<p>
210</p>
</td>
</tr>
<tr>
<td style="width:174px;height:21px;">
<p>
PRVU</p>
</td>
<td style="width:176px;height:21px;">
<p>
NRS. 1.046 crores</p>
</td>
<td style="width:174px;height:21px;">
<p>
224</p>
</td>
</tr>
<tr>
<td style="width:174px;height:22px;">
<p>
NICA</p>
</td>
<td style="width:176px;height:22px;">
<p>
NRs. 1.035 crores</p>
</td>
<td style="width:174px;height:22px;">
<p>
391</p>
</td>
</tr>
<tr>
<td style="width:174px;height:22px;">
<p>
CBBL</p>
</td>
<td style="width:176px;height:22px;">
<p>
NRs. 0.772 crores</p>
</td>
<td style="width:174px;height:22px;">
<p>
886</p>
</td>
</tr>
<tr>
<td style="width:174px;height:22px;">
<p>
CIT</p>
</td>
<td style="width:176px;height:22px;">
<p>
NRs. 0754 crores</p>
</td>
<td style="width:174px;height:22px;">
<p>
2,563</p>
</td>
</tr>
</tbody>
</table>
<p>
<strong>Conclusion</strong></p>
<p>
It is said that the stock market progressions are always process of anomalous and adventure.</p>
<p>
Sometimes lousy movements, sometimes very disciplined and calculative and sometimes very wild with high motility behaviors.</p>
<p>
For past few weeks markets have shown choppy to down trend Trading courses.</p>
<p>
But this few weeks market has shown a recovery sign both in Index value and volume.</p>
<p>
If we look at past years same months (magh, falgun and chaitra). The market had shown a recovery but only for short time. The market has shown a recovery but only for short time. The difference is the market turnover used to be more than Rs. 100 crores per day during last couple of years, but this time market turnover has been as meager Rs. 20 crores per day in average for long periods. Still, If analysis is to be made on volume side, though with meager, rise market show a sign of recovery with mild reliability.</p>
<p>
</p>
<p>
The support and resistant's on the charts have been distinguished on the charts below.</p>
<p>
</p>
<p>
<img alt="" src="/app/webroot/userfiles/images/Vacancies/march%208%20pic%202.jpg" style="width: 800px; height: 600px;" /></p>
<p>
<strong> NEPSE monthly chart with multiple support and resistant</strong></p>
<p>
</p>
<p>
a) Bearish channel, Strong support at 1064- 1040.</p>
<p>
b) Bullish channel, Strong Resistant at 1183- 1204.</p>
<p>
</p>
<p>
</p>
<p>
<img alt="" src="/app/webroot/userfiles/images/Vacancies/march%208%20pic%203.jpg" style="width: 800px; height: 600px;" /></p>
<p>
<strong> NEPSE weekly candle stick</strong></p>
<p>
a) Inside the bearish channel markets range for next few weeks are as:</p>
<p>
i) Current Market Price (CMP) = 1127.77</p>
<p>
ii) Support: Initial support = 1121.23</p>
<p>
Intermediary support =1098/1096</p>
<p>
Final support = 1065.11</p>
<p>
iii) Resistant: Initial resistant = 1148.81</p>
<p>
Final resistant = 1183.06</p>
<p>
b) Bullish engulfing candle stock pattern with mild reliability.</p>
<p>
</p>
<p>
<img alt="" src="/app/webroot/userfiles/images/Vacancies/march%208%20pic%204.jpg" style="width: 800px; height: 600px;" /></p>
<p>
<strong>Nepse daily candle stick</strong></p>
<p>
</p>
<p>
a) The market has been seemed to increase in its volume and index too.</p>
<p>
b) Some may want to sell and some may want to buy the share.</p>
<p>
c) The most increased points among all was of life insurance.</p>
<p>
</p>
<p>
<strong> Fundamentals:</strong></p>
<p>
1) Next week falgun closing is ahead.</p>
<p>
2) Next month 3rd fiscal quarterly closing starts.</p>
<p>
a) If banks are provided with enough liquidity, the current bullish market would be approved for </p>
<p>
further price gain.</p>
<p>
b) In case the banks are not comfortable with enough liquidity, chaitra 2nd/ 3rd week may face a </p>
<p>
panic sell in market.</p>
<p>
c) Since third quarter is in verge to close, government and its agency seems claiming a robust fiscal</p>
<p>
growth amid various challenges.</p>
<p>
d) The most important factor is, if government is ready to spend the allocated budget in chaitra? or</p>
<p>
will it wait for next month.</p>
<p>
</p>
<p>
</p>
<p>
</p>
<p>
<strong> Happy trading……..!!!!!!!</strong></p>
<p>
</p>
<p>
</p>
',
'published' => true,
'created' => '2019-03-08',
'modified' => '2019-03-08',
'keywords' => '',
'description' => '',
'sortorder' => '9986',
'image' => '20190308062910_march 8 pic 2.jpg',
'article_date' => '2019-03-08 00:00:00',
'homepage' => true,
'breaking_news' => false,
'main_news' => false,
'in_scroller' => false,
'user_id' => '22'
),
'ArticleCategory' => array(
'id' => '1',
'name' => 'NEWS',
'parentOf' => '0',
'published' => true,
'registered' => '2015-07-20 00:00:00',
'sortorder' => '158',
'del_flag' => '0',
'homepage' => true,
'display_in_menu' => true,
'user_id' => '1',
'created' => '0000-00-00 00:00:00',
'modified' => '2018-11-22 11:58:49'
),
'User' => array(
'password' => '*****',
'id' => '22',
'user_detail_id' => '1',
'group_id' => '24',
'username' => 'kishor.bam@newbusinessage.com',
'name' => '',
'email' => 'kishor.bam@newbusinessage.com',
'address' => '',
'gender' => '',
'access' => '1',
'phone' => '',
'access_type' => '0',
'activated' => false,
'sortorder' => '0',
'published' => '0',
'created' => '2018-11-30 10:47:22',
'last_login' => '2019-06-09 10:32:40',
'ip' => '202.63.242.112'
),
'ArticleComment' => array(),
'ArticleFeature' => array(),
'ArticleHasAuthor' => array(),
'ArticleHasTag' => array(),
'ArticleView' => array(
(int) 0 => array(
[maximum depth reached]
)
),
'Slider' => array()
),
'current_user' => null,
'logged_in' => false
)
$article = array(
'Article' => array(
'id' => '10220',
'article_category_id' => '1',
'title' => 'Market Watch of March 7',
'sub_title' => '',
'summary' => 'The CMP of 23rd Falgun is 1,127.77 which are above the daily pivot of 1,122.41 as well as above the weekly pivot 1,118.16.',
'content' => '<p>
<strong>Current market price (CMP): </strong><strong>1,127.77</strong></p>
<p>
</p>
<p>
<strong>OHLC update of this week: </strong></p>
<p>
O: 1105.53</p>
<p>
H: 1127.77</p>
<p>
L: 1098.95</p>
<p>
C: 1127.77</p>
<p>
</p>
<p>
<strong>Pivot table for next week (26th to 30th falgun): </strong></p>
<table border="1" cellpadding="0" cellspacing="0">
<tbody>
<tr>
<td style="width:91px;">
<p align="center">
<strong>S3</strong></p>
</td>
<td style="width:91px;">
<p align="center">
<strong>S2</strong></p>
</td>
<td style="width:91px;">
<p align="center">
<strong>S1</strong></p>
</td>
<td style="width:91px;">
<p align="center">
<strong>Pivot</strong></p>
</td>
<td style="width:91px;">
<p align="center">
<strong>R1</strong></p>
</td>
<td style="width:91px;">
<p align="center">
<strong>R2</strong></p>
</td>
<td style="width:91px;">
<p align="center">
<strong>R3</strong></p>
</td>
</tr>
<tr>
<td style="width:91px;">
<p align="center">
1,079.74</p>
</td>
<td style="width:91px;">
<p align="center">
1,089.34</p>
</td>
<td style="width:91px;">
<p align="center">
1,108.56</p>
</td>
<td style="width:91px;">
<p align="center">
1,118.16</p>
</td>
<td style="width:91px;">
<p align="center">
1,137.38</p>
</td>
<td style="width:91px;">
<p align="center">
1,146.98</p>
</td>
<td style="width:91px;">
<p align="center">
1,166.2</p>
</td>
</tr>
</tbody>
</table>
<p align="center">
</p>
<p>
<strong>Pivot for this month:</strong></p>
<table align="left" border="1" cellpadding="0" cellspacing="0" style="width:658px;" width="658">
<tbody>
<tr>
<td style="width:94px;height:22px;">
<p style="text-align: center;">
<strong>S3</strong></p>
</td>
<td style="width:94px;height:22px;">
<p style="text-align: center;">
<strong>S2</strong></p>
</td>
<td style="width:94px;height:22px;">
<p style="text-align: center;">
<strong>S1</strong></p>
</td>
<td style="width:88px;height:22px;">
<p style="text-align: center;">
<strong>Pivot</strong></p>
</td>
<td style="width:96px;height:22px;">
<p style="text-align: center;">
<strong>R1</strong></p>
</td>
<td style="width:96px;height:22px;">
<p style="text-align: center;">
<strong>R2</strong></p>
</td>
<td style="width:96px;height:22px;">
<p style="text-align: center;">
<strong>R3</strong></p>
</td>
</tr>
<tr>
<td style="width:94px;height:22px;">
<p style="text-align: center;">
<strong>1025.74 </strong></p>
</td>
<td style="width:94px;height:22px;">
<p style="text-align: center;">
<strong>1075.08 </strong></p>
</td>
<td style="width:94px;height:22px;">
<p style="text-align: center;">
<strong>1101.64 </strong></p>
</td>
<td style="width:88px;height:22px;">
<p style="text-align: center;">
<strong>1150.98 </strong></p>
</td>
<td style="width:96px;height:22px;">
<p style="text-align: center;">
<strong>1177.54 </strong></p>
</td>
<td style="width:96px;height:22px;">
<p style="text-align: center;">
<strong>1226.88 </strong></p>
</td>
<td style="width:96px;height:22px;">
<p style="text-align: center;">
<strong>1253.44 </strong></p>
</td>
</tr>
</tbody>
</table>
<p style="text-align: center;">
</p>
<p style="text-align: center;">
</p>
<p style="text-align: center;">
</p>
<p>
<strong>Volume:</strong></p>
<p>
This week: 96.37 crores</p>
<p>
Last week: 79.75 crores</p>
<p align="center">
</p>
<p>
<strong>Projected range for next week: 1,113.36 to 1,142.18</strong></p>
<p>
<strong>OHLC update of 23<sup>rd</sup> Falgun:</strong></p>
<p>
O: 1111.76</p>
<p>
H: 1127.77</p>
<p>
L: 1111.70</p>
<p>
C: 1127.77</p>
<p>
<strong>Pivot table for 26<sup>th</sup> Falgun: </strong></p>
<table border="1" cellpadding="0" cellspacing="0">
<tbody>
<tr>
<td style="width:91px;">
<p align="center">
<strong>S3</strong></p>
</td>
<td style="width:91px;">
<p align="center">
<strong>S2</strong></p>
</td>
<td style="width:91px;">
<p align="center">
<strong>S1</strong></p>
</td>
<td style="width:91px;">
<p align="center">
<strong>Pivot</strong></p>
</td>
<td style="width:91px;">
<p align="center">
<strong>R1</strong></p>
</td>
<td style="width:91px;">
<p align="center">
<strong>R2</strong></p>
</td>
<td style="width:91px;">
<p align="center">
<strong>R3</strong></p>
</td>
</tr>
<tr>
<td style="width:91px;">
<p align="center">
1,100.99</p>
</td>
<td style="width:91px;">
<p align="center">
1,106.34</p>
</td>
<td style="width:91px;">
<p align="center">
1,117.06</p>
</td>
<td style="width:91px;">
<p align="center">
1,122.41</p>
</td>
<td style="width:91px;">
<p align="center">
1,133.13</p>
</td>
<td style="width:91px;">
<p align="center">
1,138.48</p>
</td>
<td style="width:91px;">
<p align="center">
1,149.2</p>
</td>
</tr>
</tbody>
</table>
<p align="center">
</p>
<p>
<strong>Turnover:</strong></p>
<p>
This week (19<sup>th</sup> to 23<sup>rd</sup> Falgun): 96.37 crores</p>
<p>
Last week (12<sup>th</sup> to 16<sup>th</sup> Falgun): 79.75 crores</p>
<p>
23<sup>rd</sup> Falgun: 29.39 crores</p>
<p>
</p>
<p>
<strong>Outlook: </strong></p>
<p>
The CMP of 23<sup>rd</sup> Falgun is 1,127.77 which are above the daily pivot of 1,122.41 as well as above the weekly pivot 1,118.16.</p>
<p>
</p>
<p>
<strong>Sub indices market information: </strong></p>
<ul>
<li>
- Life insurance has increased by 159.32 points in index value.</li>
<li>
- Non life insurance has increased by 105.24 points in index value.</li>
<li>
- Banking has increased by 13.92 points in index value.</li>
</ul>
<p>
</p>
<p>
<img alt="" src="/app/webroot/userfiles/images/Vacancies/march%208%20pic%201.jpg" style="width: 800px; height: 600px;" /></p>
<p>
<strong> Banking candle stick chart</strong></p>
<p style="margin-left:.25in;">
</p>
<p style="margin-left:.25in;">
<strong>The top 5 scrips of banking in turnover are: </strong></p>
<table border="1" cellpadding="0" cellspacing="0">
<tbody>
<tr>
<td style="width:174px;height:22px;">
<p>
<strong>Scrips</strong></p>
</td>
<td style="width:176px;height:22px;">
<p>
<strong>Turnover</strong></p>
</td>
<td style="width:174px;height:22px;">
<p>
<strong>LTP</strong></p>
</td>
</tr>
<tr>
<td style="width:174px;height:22px;">
<p>
NCCB</p>
</td>
<td style="width:176px;height:22px;">
<p>
NRS. 1.282 crores</p>
</td>
<td style="width:174px;height:22px;">
<p>
210</p>
</td>
</tr>
<tr>
<td style="width:174px;height:21px;">
<p>
PRVU</p>
</td>
<td style="width:176px;height:21px;">
<p>
NRS. 1.046 crores</p>
</td>
<td style="width:174px;height:21px;">
<p>
224</p>
</td>
</tr>
<tr>
<td style="width:174px;height:22px;">
<p>
NICA</p>
</td>
<td style="width:176px;height:22px;">
<p>
NRs. 1.035 crores</p>
</td>
<td style="width:174px;height:22px;">
<p>
391</p>
</td>
</tr>
<tr>
<td style="width:174px;height:22px;">
<p>
CBBL</p>
</td>
<td style="width:176px;height:22px;">
<p>
NRs. 0.772 crores</p>
</td>
<td style="width:174px;height:22px;">
<p>
886</p>
</td>
</tr>
<tr>
<td style="width:174px;height:22px;">
<p>
CIT</p>
</td>
<td style="width:176px;height:22px;">
<p>
NRs. 0754 crores</p>
</td>
<td style="width:174px;height:22px;">
<p>
2,563</p>
</td>
</tr>
</tbody>
</table>
<p>
<strong>Conclusion</strong></p>
<p>
It is said that the stock market progressions are always process of anomalous and adventure.</p>
<p>
Sometimes lousy movements, sometimes very disciplined and calculative and sometimes very wild with high motility behaviors.</p>
<p>
For past few weeks markets have shown choppy to down trend Trading courses.</p>
<p>
But this few weeks market has shown a recovery sign both in Index value and volume.</p>
<p>
If we look at past years same months (magh, falgun and chaitra). The market had shown a recovery but only for short time. The market has shown a recovery but only for short time. The difference is the market turnover used to be more than Rs. 100 crores per day during last couple of years, but this time market turnover has been as meager Rs. 20 crores per day in average for long periods. Still, If analysis is to be made on volume side, though with meager, rise market show a sign of recovery with mild reliability.</p>
<p>
</p>
<p>
The support and resistant's on the charts have been distinguished on the charts below.</p>
<p>
</p>
<p>
<img alt="" src="/app/webroot/userfiles/images/Vacancies/march%208%20pic%202.jpg" style="width: 800px; height: 600px;" /></p>
<p>
<strong> NEPSE monthly chart with multiple support and resistant</strong></p>
<p>
</p>
<p>
a) Bearish channel, Strong support at 1064- 1040.</p>
<p>
b) Bullish channel, Strong Resistant at 1183- 1204.</p>
<p>
</p>
<p>
</p>
<p>
<img alt="" src="/app/webroot/userfiles/images/Vacancies/march%208%20pic%203.jpg" style="width: 800px; height: 600px;" /></p>
<p>
<strong> NEPSE weekly candle stick</strong></p>
<p>
a) Inside the bearish channel markets range for next few weeks are as:</p>
<p>
i) Current Market Price (CMP) = 1127.77</p>
<p>
ii) Support: Initial support = 1121.23</p>
<p>
Intermediary support =1098/1096</p>
<p>
Final support = 1065.11</p>
<p>
iii) Resistant: Initial resistant = 1148.81</p>
<p>
Final resistant = 1183.06</p>
<p>
b) Bullish engulfing candle stock pattern with mild reliability.</p>
<p>
</p>
<p>
<img alt="" src="/app/webroot/userfiles/images/Vacancies/march%208%20pic%204.jpg" style="width: 800px; height: 600px;" /></p>
<p>
<strong>Nepse daily candle stick</strong></p>
<p>
</p>
<p>
a) The market has been seemed to increase in its volume and index too.</p>
<p>
b) Some may want to sell and some may want to buy the share.</p>
<p>
c) The most increased points among all was of life insurance.</p>
<p>
</p>
<p>
<strong> Fundamentals:</strong></p>
<p>
1) Next week falgun closing is ahead.</p>
<p>
2) Next month 3rd fiscal quarterly closing starts.</p>
<p>
a) If banks are provided with enough liquidity, the current bullish market would be approved for </p>
<p>
further price gain.</p>
<p>
b) In case the banks are not comfortable with enough liquidity, chaitra 2nd/ 3rd week may face a </p>
<p>
panic sell in market.</p>
<p>
c) Since third quarter is in verge to close, government and its agency seems claiming a robust fiscal</p>
<p>
growth amid various challenges.</p>
<p>
d) The most important factor is, if government is ready to spend the allocated budget in chaitra? or</p>
<p>
will it wait for next month.</p>
<p>
</p>
<p>
</p>
<p>
</p>
<p>
<strong> Happy trading……..!!!!!!!</strong></p>
<p>
</p>
<p>
</p>
',
'published' => true,
'created' => '2019-03-08',
'modified' => '2019-03-08',
'keywords' => '',
'description' => '',
'sortorder' => '9986',
'image' => '20190308062910_march 8 pic 2.jpg',
'article_date' => '2019-03-08 00:00:00',
'homepage' => true,
'breaking_news' => false,
'main_news' => false,
'in_scroller' => false,
'user_id' => '22'
),
'ArticleCategory' => array(
'id' => '1',
'name' => 'NEWS',
'parentOf' => '0',
'published' => true,
'registered' => '2015-07-20 00:00:00',
'sortorder' => '158',
'del_flag' => '0',
'homepage' => true,
'display_in_menu' => true,
'user_id' => '1',
'created' => '0000-00-00 00:00:00',
'modified' => '2018-11-22 11:58:49'
),
'User' => array(
'password' => '*****',
'id' => '22',
'user_detail_id' => '1',
'group_id' => '24',
'username' => 'kishor.bam@newbusinessage.com',
'name' => '',
'email' => 'kishor.bam@newbusinessage.com',
'address' => '',
'gender' => '',
'access' => '1',
'phone' => '',
'access_type' => '0',
'activated' => false,
'sortorder' => '0',
'published' => '0',
'created' => '2018-11-30 10:47:22',
'last_login' => '2019-06-09 10:32:40',
'ip' => '202.63.242.112'
),
'ArticleComment' => array(),
'ArticleFeature' => array(),
'ArticleHasAuthor' => array(),
'ArticleHasTag' => array(),
'ArticleView' => array(
(int) 0 => array(
'article_id' => '10220',
'hit' => '1290'
)
),
'Slider' => array()
)
$current_user = null
$logged_in = false
$xml = false
include - APP/View/Elements/side_bar.ctp, line 133
View::_evaluate() - CORE/Cake/View/View.php, line 971
View::_render() - CORE/Cake/View/View.php, line 933
View::_renderElement() - CORE/Cake/View/View.php, line 1224
View::element() - CORE/Cake/View/View.php, line 418
include - APP/View/Articles/view.ctp, line 391
View::_evaluate() - CORE/Cake/View/View.php, line 971
View::_render() - CORE/Cake/View/View.php, line 933
View::render() - CORE/Cake/View/View.php, line 473
Controller::render() - CORE/Cake/Controller/Controller.php, line 968
Dispatcher::_invoke() - CORE/Cake/Routing/Dispatcher.php, line 200
Dispatcher::dispatch() - CORE/Cake/Routing/Dispatcher.php, line 167
[main] - APP/webroot/index.php, line 117
Warning (2): simplexml_load_file() [<a href='http://php.net/function.simplexml-load-file'>function.simplexml-load-file</a>]: I/O warning : failed to load external entity "" [APP/View/Elements/side_bar.ctp, line 133]
$viewFile = '/var/www/html/newbusinessage.com/app/View/Elements/side_bar.ctp'
$dataForView = array(
'article' => array(
'Article' => array(
'id' => '10220',
'article_category_id' => '1',
'title' => 'Market Watch of March 7',
'sub_title' => '',
'summary' => 'The CMP of 23rd Falgun is 1,127.77 which are above the daily pivot of 1,122.41 as well as above the weekly pivot 1,118.16.',
'content' => '<p>
<strong>Current market price (CMP): </strong><strong>1,127.77</strong></p>
<p>
</p>
<p>
<strong>OHLC update of this week: </strong></p>
<p>
O: 1105.53</p>
<p>
H: 1127.77</p>
<p>
L: 1098.95</p>
<p>
C: 1127.77</p>
<p>
</p>
<p>
<strong>Pivot table for next week (26th to 30th falgun): </strong></p>
<table border="1" cellpadding="0" cellspacing="0">
<tbody>
<tr>
<td style="width:91px;">
<p align="center">
<strong>S3</strong></p>
</td>
<td style="width:91px;">
<p align="center">
<strong>S2</strong></p>
</td>
<td style="width:91px;">
<p align="center">
<strong>S1</strong></p>
</td>
<td style="width:91px;">
<p align="center">
<strong>Pivot</strong></p>
</td>
<td style="width:91px;">
<p align="center">
<strong>R1</strong></p>
</td>
<td style="width:91px;">
<p align="center">
<strong>R2</strong></p>
</td>
<td style="width:91px;">
<p align="center">
<strong>R3</strong></p>
</td>
</tr>
<tr>
<td style="width:91px;">
<p align="center">
1,079.74</p>
</td>
<td style="width:91px;">
<p align="center">
1,089.34</p>
</td>
<td style="width:91px;">
<p align="center">
1,108.56</p>
</td>
<td style="width:91px;">
<p align="center">
1,118.16</p>
</td>
<td style="width:91px;">
<p align="center">
1,137.38</p>
</td>
<td style="width:91px;">
<p align="center">
1,146.98</p>
</td>
<td style="width:91px;">
<p align="center">
1,166.2</p>
</td>
</tr>
</tbody>
</table>
<p align="center">
</p>
<p>
<strong>Pivot for this month:</strong></p>
<table align="left" border="1" cellpadding="0" cellspacing="0" style="width:658px;" width="658">
<tbody>
<tr>
<td style="width:94px;height:22px;">
<p style="text-align: center;">
<strong>S3</strong></p>
</td>
<td style="width:94px;height:22px;">
<p style="text-align: center;">
<strong>S2</strong></p>
</td>
<td style="width:94px;height:22px;">
<p style="text-align: center;">
<strong>S1</strong></p>
</td>
<td style="width:88px;height:22px;">
<p style="text-align: center;">
<strong>Pivot</strong></p>
</td>
<td style="width:96px;height:22px;">
<p style="text-align: center;">
<strong>R1</strong></p>
</td>
<td style="width:96px;height:22px;">
<p style="text-align: center;">
<strong>R2</strong></p>
</td>
<td style="width:96px;height:22px;">
<p style="text-align: center;">
<strong>R3</strong></p>
</td>
</tr>
<tr>
<td style="width:94px;height:22px;">
<p style="text-align: center;">
<strong>1025.74 </strong></p>
</td>
<td style="width:94px;height:22px;">
<p style="text-align: center;">
<strong>1075.08 </strong></p>
</td>
<td style="width:94px;height:22px;">
<p style="text-align: center;">
<strong>1101.64 </strong></p>
</td>
<td style="width:88px;height:22px;">
<p style="text-align: center;">
<strong>1150.98 </strong></p>
</td>
<td style="width:96px;height:22px;">
<p style="text-align: center;">
<strong>1177.54 </strong></p>
</td>
<td style="width:96px;height:22px;">
<p style="text-align: center;">
<strong>1226.88 </strong></p>
</td>
<td style="width:96px;height:22px;">
<p style="text-align: center;">
<strong>1253.44 </strong></p>
</td>
</tr>
</tbody>
</table>
<p style="text-align: center;">
</p>
<p style="text-align: center;">
</p>
<p style="text-align: center;">
</p>
<p>
<strong>Volume:</strong></p>
<p>
This week: 96.37 crores</p>
<p>
Last week: 79.75 crores</p>
<p align="center">
</p>
<p>
<strong>Projected range for next week: 1,113.36 to 1,142.18</strong></p>
<p>
<strong>OHLC update of 23<sup>rd</sup> Falgun:</strong></p>
<p>
O: 1111.76</p>
<p>
H: 1127.77</p>
<p>
L: 1111.70</p>
<p>
C: 1127.77</p>
<p>
<strong>Pivot table for 26<sup>th</sup> Falgun: </strong></p>
<table border="1" cellpadding="0" cellspacing="0">
<tbody>
<tr>
<td style="width:91px;">
<p align="center">
<strong>S3</strong></p>
</td>
<td style="width:91px;">
<p align="center">
<strong>S2</strong></p>
</td>
<td style="width:91px;">
<p align="center">
<strong>S1</strong></p>
</td>
<td style="width:91px;">
<p align="center">
<strong>Pivot</strong></p>
</td>
<td style="width:91px;">
<p align="center">
<strong>R1</strong></p>
</td>
<td style="width:91px;">
<p align="center">
<strong>R2</strong></p>
</td>
<td style="width:91px;">
<p align="center">
<strong>R3</strong></p>
</td>
</tr>
<tr>
<td style="width:91px;">
<p align="center">
1,100.99</p>
</td>
<td style="width:91px;">
<p align="center">
1,106.34</p>
</td>
<td style="width:91px;">
<p align="center">
1,117.06</p>
</td>
<td style="width:91px;">
<p align="center">
1,122.41</p>
</td>
<td style="width:91px;">
<p align="center">
1,133.13</p>
</td>
<td style="width:91px;">
<p align="center">
1,138.48</p>
</td>
<td style="width:91px;">
<p align="center">
1,149.2</p>
</td>
</tr>
</tbody>
</table>
<p align="center">
</p>
<p>
<strong>Turnover:</strong></p>
<p>
This week (19<sup>th</sup> to 23<sup>rd</sup> Falgun): 96.37 crores</p>
<p>
Last week (12<sup>th</sup> to 16<sup>th</sup> Falgun): 79.75 crores</p>
<p>
23<sup>rd</sup> Falgun: 29.39 crores</p>
<p>
</p>
<p>
<strong>Outlook: </strong></p>
<p>
The CMP of 23<sup>rd</sup> Falgun is 1,127.77 which are above the daily pivot of 1,122.41 as well as above the weekly pivot 1,118.16.</p>
<p>
</p>
<p>
<strong>Sub indices market information: </strong></p>
<ul>
<li>
- Life insurance has increased by 159.32 points in index value.</li>
<li>
- Non life insurance has increased by 105.24 points in index value.</li>
<li>
- Banking has increased by 13.92 points in index value.</li>
</ul>
<p>
</p>
<p>
<img alt="" src="/app/webroot/userfiles/images/Vacancies/march%208%20pic%201.jpg" style="width: 800px; height: 600px;" /></p>
<p>
<strong> Banking candle stick chart</strong></p>
<p style="margin-left:.25in;">
</p>
<p style="margin-left:.25in;">
<strong>The top 5 scrips of banking in turnover are: </strong></p>
<table border="1" cellpadding="0" cellspacing="0">
<tbody>
<tr>
<td style="width:174px;height:22px;">
<p>
<strong>Scrips</strong></p>
</td>
<td style="width:176px;height:22px;">
<p>
<strong>Turnover</strong></p>
</td>
<td style="width:174px;height:22px;">
<p>
<strong>LTP</strong></p>
</td>
</tr>
<tr>
<td style="width:174px;height:22px;">
<p>
NCCB</p>
</td>
<td style="width:176px;height:22px;">
<p>
NRS. 1.282 crores</p>
</td>
<td style="width:174px;height:22px;">
<p>
210</p>
</td>
</tr>
<tr>
<td style="width:174px;height:21px;">
<p>
PRVU</p>
</td>
<td style="width:176px;height:21px;">
<p>
NRS. 1.046 crores</p>
</td>
<td style="width:174px;height:21px;">
<p>
224</p>
</td>
</tr>
<tr>
<td style="width:174px;height:22px;">
<p>
NICA</p>
</td>
<td style="width:176px;height:22px;">
<p>
NRs. 1.035 crores</p>
</td>
<td style="width:174px;height:22px;">
<p>
391</p>
</td>
</tr>
<tr>
<td style="width:174px;height:22px;">
<p>
CBBL</p>
</td>
<td style="width:176px;height:22px;">
<p>
NRs. 0.772 crores</p>
</td>
<td style="width:174px;height:22px;">
<p>
886</p>
</td>
</tr>
<tr>
<td style="width:174px;height:22px;">
<p>
CIT</p>
</td>
<td style="width:176px;height:22px;">
<p>
NRs. 0754 crores</p>
</td>
<td style="width:174px;height:22px;">
<p>
2,563</p>
</td>
</tr>
</tbody>
</table>
<p>
<strong>Conclusion</strong></p>
<p>
It is said that the stock market progressions are always process of anomalous and adventure.</p>
<p>
Sometimes lousy movements, sometimes very disciplined and calculative and sometimes very wild with high motility behaviors.</p>
<p>
For past few weeks markets have shown choppy to down trend Trading courses.</p>
<p>
But this few weeks market has shown a recovery sign both in Index value and volume.</p>
<p>
If we look at past years same months (magh, falgun and chaitra). The market had shown a recovery but only for short time. The market has shown a recovery but only for short time. The difference is the market turnover used to be more than Rs. 100 crores per day during last couple of years, but this time market turnover has been as meager Rs. 20 crores per day in average for long periods. Still, If analysis is to be made on volume side, though with meager, rise market show a sign of recovery with mild reliability.</p>
<p>
</p>
<p>
The support and resistant's on the charts have been distinguished on the charts below.</p>
<p>
</p>
<p>
<img alt="" src="/app/webroot/userfiles/images/Vacancies/march%208%20pic%202.jpg" style="width: 800px; height: 600px;" /></p>
<p>
<strong> NEPSE monthly chart with multiple support and resistant</strong></p>
<p>
</p>
<p>
a) Bearish channel, Strong support at 1064- 1040.</p>
<p>
b) Bullish channel, Strong Resistant at 1183- 1204.</p>
<p>
</p>
<p>
</p>
<p>
<img alt="" src="/app/webroot/userfiles/images/Vacancies/march%208%20pic%203.jpg" style="width: 800px; height: 600px;" /></p>
<p>
<strong> NEPSE weekly candle stick</strong></p>
<p>
a) Inside the bearish channel markets range for next few weeks are as:</p>
<p>
i) Current Market Price (CMP) = 1127.77</p>
<p>
ii) Support: Initial support = 1121.23</p>
<p>
Intermediary support =1098/1096</p>
<p>
Final support = 1065.11</p>
<p>
iii) Resistant: Initial resistant = 1148.81</p>
<p>
Final resistant = 1183.06</p>
<p>
b) Bullish engulfing candle stock pattern with mild reliability.</p>
<p>
</p>
<p>
<img alt="" src="/app/webroot/userfiles/images/Vacancies/march%208%20pic%204.jpg" style="width: 800px; height: 600px;" /></p>
<p>
<strong>Nepse daily candle stick</strong></p>
<p>
</p>
<p>
a) The market has been seemed to increase in its volume and index too.</p>
<p>
b) Some may want to sell and some may want to buy the share.</p>
<p>
c) The most increased points among all was of life insurance.</p>
<p>
</p>
<p>
<strong> Fundamentals:</strong></p>
<p>
1) Next week falgun closing is ahead.</p>
<p>
2) Next month 3rd fiscal quarterly closing starts.</p>
<p>
a) If banks are provided with enough liquidity, the current bullish market would be approved for </p>
<p>
further price gain.</p>
<p>
b) In case the banks are not comfortable with enough liquidity, chaitra 2nd/ 3rd week may face a </p>
<p>
panic sell in market.</p>
<p>
c) Since third quarter is in verge to close, government and its agency seems claiming a robust fiscal</p>
<p>
growth amid various challenges.</p>
<p>
d) The most important factor is, if government is ready to spend the allocated budget in chaitra? or</p>
<p>
will it wait for next month.</p>
<p>
</p>
<p>
</p>
<p>
</p>
<p>
<strong> Happy trading……..!!!!!!!</strong></p>
<p>
</p>
<p>
</p>
',
'published' => true,
'created' => '2019-03-08',
'modified' => '2019-03-08',
'keywords' => '',
'description' => '',
'sortorder' => '9986',
'image' => '20190308062910_march 8 pic 2.jpg',
'article_date' => '2019-03-08 00:00:00',
'homepage' => true,
'breaking_news' => false,
'main_news' => false,
'in_scroller' => false,
'user_id' => '22'
),
'ArticleCategory' => array(
'id' => '1',
'name' => 'NEWS',
'parentOf' => '0',
'published' => true,
'registered' => '2015-07-20 00:00:00',
'sortorder' => '158',
'del_flag' => '0',
'homepage' => true,
'display_in_menu' => true,
'user_id' => '1',
'created' => '0000-00-00 00:00:00',
'modified' => '2018-11-22 11:58:49'
),
'User' => array(
'password' => '*****',
'id' => '22',
'user_detail_id' => '1',
'group_id' => '24',
'username' => 'kishor.bam@newbusinessage.com',
'name' => '',
'email' => 'kishor.bam@newbusinessage.com',
'address' => '',
'gender' => '',
'access' => '1',
'phone' => '',
'access_type' => '0',
'activated' => false,
'sortorder' => '0',
'published' => '0',
'created' => '2018-11-30 10:47:22',
'last_login' => '2019-06-09 10:32:40',
'ip' => '202.63.242.112'
),
'ArticleComment' => array(),
'ArticleFeature' => array(),
'ArticleHasAuthor' => array(),
'ArticleHasTag' => array(),
'ArticleView' => array(
(int) 0 => array(
[maximum depth reached]
)
),
'Slider' => array()
),
'current_user' => null,
'logged_in' => false
)
$article = array(
'Article' => array(
'id' => '10220',
'article_category_id' => '1',
'title' => 'Market Watch of March 7',
'sub_title' => '',
'summary' => 'The CMP of 23rd Falgun is 1,127.77 which are above the daily pivot of 1,122.41 as well as above the weekly pivot 1,118.16.',
'content' => '<p>
<strong>Current market price (CMP): </strong><strong>1,127.77</strong></p>
<p>
</p>
<p>
<strong>OHLC update of this week: </strong></p>
<p>
O: 1105.53</p>
<p>
H: 1127.77</p>
<p>
L: 1098.95</p>
<p>
C: 1127.77</p>
<p>
</p>
<p>
<strong>Pivot table for next week (26th to 30th falgun): </strong></p>
<table border="1" cellpadding="0" cellspacing="0">
<tbody>
<tr>
<td style="width:91px;">
<p align="center">
<strong>S3</strong></p>
</td>
<td style="width:91px;">
<p align="center">
<strong>S2</strong></p>
</td>
<td style="width:91px;">
<p align="center">
<strong>S1</strong></p>
</td>
<td style="width:91px;">
<p align="center">
<strong>Pivot</strong></p>
</td>
<td style="width:91px;">
<p align="center">
<strong>R1</strong></p>
</td>
<td style="width:91px;">
<p align="center">
<strong>R2</strong></p>
</td>
<td style="width:91px;">
<p align="center">
<strong>R3</strong></p>
</td>
</tr>
<tr>
<td style="width:91px;">
<p align="center">
1,079.74</p>
</td>
<td style="width:91px;">
<p align="center">
1,089.34</p>
</td>
<td style="width:91px;">
<p align="center">
1,108.56</p>
</td>
<td style="width:91px;">
<p align="center">
1,118.16</p>
</td>
<td style="width:91px;">
<p align="center">
1,137.38</p>
</td>
<td style="width:91px;">
<p align="center">
1,146.98</p>
</td>
<td style="width:91px;">
<p align="center">
1,166.2</p>
</td>
</tr>
</tbody>
</table>
<p align="center">
</p>
<p>
<strong>Pivot for this month:</strong></p>
<table align="left" border="1" cellpadding="0" cellspacing="0" style="width:658px;" width="658">
<tbody>
<tr>
<td style="width:94px;height:22px;">
<p style="text-align: center;">
<strong>S3</strong></p>
</td>
<td style="width:94px;height:22px;">
<p style="text-align: center;">
<strong>S2</strong></p>
</td>
<td style="width:94px;height:22px;">
<p style="text-align: center;">
<strong>S1</strong></p>
</td>
<td style="width:88px;height:22px;">
<p style="text-align: center;">
<strong>Pivot</strong></p>
</td>
<td style="width:96px;height:22px;">
<p style="text-align: center;">
<strong>R1</strong></p>
</td>
<td style="width:96px;height:22px;">
<p style="text-align: center;">
<strong>R2</strong></p>
</td>
<td style="width:96px;height:22px;">
<p style="text-align: center;">
<strong>R3</strong></p>
</td>
</tr>
<tr>
<td style="width:94px;height:22px;">
<p style="text-align: center;">
<strong>1025.74 </strong></p>
</td>
<td style="width:94px;height:22px;">
<p style="text-align: center;">
<strong>1075.08 </strong></p>
</td>
<td style="width:94px;height:22px;">
<p style="text-align: center;">
<strong>1101.64 </strong></p>
</td>
<td style="width:88px;height:22px;">
<p style="text-align: center;">
<strong>1150.98 </strong></p>
</td>
<td style="width:96px;height:22px;">
<p style="text-align: center;">
<strong>1177.54 </strong></p>
</td>
<td style="width:96px;height:22px;">
<p style="text-align: center;">
<strong>1226.88 </strong></p>
</td>
<td style="width:96px;height:22px;">
<p style="text-align: center;">
<strong>1253.44 </strong></p>
</td>
</tr>
</tbody>
</table>
<p style="text-align: center;">
</p>
<p style="text-align: center;">
</p>
<p style="text-align: center;">
</p>
<p>
<strong>Volume:</strong></p>
<p>
This week: 96.37 crores</p>
<p>
Last week: 79.75 crores</p>
<p align="center">
</p>
<p>
<strong>Projected range for next week: 1,113.36 to 1,142.18</strong></p>
<p>
<strong>OHLC update of 23<sup>rd</sup> Falgun:</strong></p>
<p>
O: 1111.76</p>
<p>
H: 1127.77</p>
<p>
L: 1111.70</p>
<p>
C: 1127.77</p>
<p>
<strong>Pivot table for 26<sup>th</sup> Falgun: </strong></p>
<table border="1" cellpadding="0" cellspacing="0">
<tbody>
<tr>
<td style="width:91px;">
<p align="center">
<strong>S3</strong></p>
</td>
<td style="width:91px;">
<p align="center">
<strong>S2</strong></p>
</td>
<td style="width:91px;">
<p align="center">
<strong>S1</strong></p>
</td>
<td style="width:91px;">
<p align="center">
<strong>Pivot</strong></p>
</td>
<td style="width:91px;">
<p align="center">
<strong>R1</strong></p>
</td>
<td style="width:91px;">
<p align="center">
<strong>R2</strong></p>
</td>
<td style="width:91px;">
<p align="center">
<strong>R3</strong></p>
</td>
</tr>
<tr>
<td style="width:91px;">
<p align="center">
1,100.99</p>
</td>
<td style="width:91px;">
<p align="center">
1,106.34</p>
</td>
<td style="width:91px;">
<p align="center">
1,117.06</p>
</td>
<td style="width:91px;">
<p align="center">
1,122.41</p>
</td>
<td style="width:91px;">
<p align="center">
1,133.13</p>
</td>
<td style="width:91px;">
<p align="center">
1,138.48</p>
</td>
<td style="width:91px;">
<p align="center">
1,149.2</p>
</td>
</tr>
</tbody>
</table>
<p align="center">
</p>
<p>
<strong>Turnover:</strong></p>
<p>
This week (19<sup>th</sup> to 23<sup>rd</sup> Falgun): 96.37 crores</p>
<p>
Last week (12<sup>th</sup> to 16<sup>th</sup> Falgun): 79.75 crores</p>
<p>
23<sup>rd</sup> Falgun: 29.39 crores</p>
<p>
</p>
<p>
<strong>Outlook: </strong></p>
<p>
The CMP of 23<sup>rd</sup> Falgun is 1,127.77 which are above the daily pivot of 1,122.41 as well as above the weekly pivot 1,118.16.</p>
<p>
</p>
<p>
<strong>Sub indices market information: </strong></p>
<ul>
<li>
- Life insurance has increased by 159.32 points in index value.</li>
<li>
- Non life insurance has increased by 105.24 points in index value.</li>
<li>
- Banking has increased by 13.92 points in index value.</li>
</ul>
<p>
</p>
<p>
<img alt="" src="/app/webroot/userfiles/images/Vacancies/march%208%20pic%201.jpg" style="width: 800px; height: 600px;" /></p>
<p>
<strong> Banking candle stick chart</strong></p>
<p style="margin-left:.25in;">
</p>
<p style="margin-left:.25in;">
<strong>The top 5 scrips of banking in turnover are: </strong></p>
<table border="1" cellpadding="0" cellspacing="0">
<tbody>
<tr>
<td style="width:174px;height:22px;">
<p>
<strong>Scrips</strong></p>
</td>
<td style="width:176px;height:22px;">
<p>
<strong>Turnover</strong></p>
</td>
<td style="width:174px;height:22px;">
<p>
<strong>LTP</strong></p>
</td>
</tr>
<tr>
<td style="width:174px;height:22px;">
<p>
NCCB</p>
</td>
<td style="width:176px;height:22px;">
<p>
NRS. 1.282 crores</p>
</td>
<td style="width:174px;height:22px;">
<p>
210</p>
</td>
</tr>
<tr>
<td style="width:174px;height:21px;">
<p>
PRVU</p>
</td>
<td style="width:176px;height:21px;">
<p>
NRS. 1.046 crores</p>
</td>
<td style="width:174px;height:21px;">
<p>
224</p>
</td>
</tr>
<tr>
<td style="width:174px;height:22px;">
<p>
NICA</p>
</td>
<td style="width:176px;height:22px;">
<p>
NRs. 1.035 crores</p>
</td>
<td style="width:174px;height:22px;">
<p>
391</p>
</td>
</tr>
<tr>
<td style="width:174px;height:22px;">
<p>
CBBL</p>
</td>
<td style="width:176px;height:22px;">
<p>
NRs. 0.772 crores</p>
</td>
<td style="width:174px;height:22px;">
<p>
886</p>
</td>
</tr>
<tr>
<td style="width:174px;height:22px;">
<p>
CIT</p>
</td>
<td style="width:176px;height:22px;">
<p>
NRs. 0754 crores</p>
</td>
<td style="width:174px;height:22px;">
<p>
2,563</p>
</td>
</tr>
</tbody>
</table>
<p>
<strong>Conclusion</strong></p>
<p>
It is said that the stock market progressions are always process of anomalous and adventure.</p>
<p>
Sometimes lousy movements, sometimes very disciplined and calculative and sometimes very wild with high motility behaviors.</p>
<p>
For past few weeks markets have shown choppy to down trend Trading courses.</p>
<p>
But this few weeks market has shown a recovery sign both in Index value and volume.</p>
<p>
If we look at past years same months (magh, falgun and chaitra). The market had shown a recovery but only for short time. The market has shown a recovery but only for short time. The difference is the market turnover used to be more than Rs. 100 crores per day during last couple of years, but this time market turnover has been as meager Rs. 20 crores per day in average for long periods. Still, If analysis is to be made on volume side, though with meager, rise market show a sign of recovery with mild reliability.</p>
<p>
</p>
<p>
The support and resistant's on the charts have been distinguished on the charts below.</p>
<p>
</p>
<p>
<img alt="" src="/app/webroot/userfiles/images/Vacancies/march%208%20pic%202.jpg" style="width: 800px; height: 600px;" /></p>
<p>
<strong> NEPSE monthly chart with multiple support and resistant</strong></p>
<p>
</p>
<p>
a) Bearish channel, Strong support at 1064- 1040.</p>
<p>
b) Bullish channel, Strong Resistant at 1183- 1204.</p>
<p>
</p>
<p>
</p>
<p>
<img alt="" src="/app/webroot/userfiles/images/Vacancies/march%208%20pic%203.jpg" style="width: 800px; height: 600px;" /></p>
<p>
<strong> NEPSE weekly candle stick</strong></p>
<p>
a) Inside the bearish channel markets range for next few weeks are as:</p>
<p>
i) Current Market Price (CMP) = 1127.77</p>
<p>
ii) Support: Initial support = 1121.23</p>
<p>
Intermediary support =1098/1096</p>
<p>
Final support = 1065.11</p>
<p>
iii) Resistant: Initial resistant = 1148.81</p>
<p>
Final resistant = 1183.06</p>
<p>
b) Bullish engulfing candle stock pattern with mild reliability.</p>
<p>
</p>
<p>
<img alt="" src="/app/webroot/userfiles/images/Vacancies/march%208%20pic%204.jpg" style="width: 800px; height: 600px;" /></p>
<p>
<strong>Nepse daily candle stick</strong></p>
<p>
</p>
<p>
a) The market has been seemed to increase in its volume and index too.</p>
<p>
b) Some may want to sell and some may want to buy the share.</p>
<p>
c) The most increased points among all was of life insurance.</p>
<p>
</p>
<p>
<strong> Fundamentals:</strong></p>
<p>
1) Next week falgun closing is ahead.</p>
<p>
2) Next month 3rd fiscal quarterly closing starts.</p>
<p>
a) If banks are provided with enough liquidity, the current bullish market would be approved for </p>
<p>
further price gain.</p>
<p>
b) In case the banks are not comfortable with enough liquidity, chaitra 2nd/ 3rd week may face a </p>
<p>
panic sell in market.</p>
<p>
c) Since third quarter is in verge to close, government and its agency seems claiming a robust fiscal</p>
<p>
growth amid various challenges.</p>
<p>
d) The most important factor is, if government is ready to spend the allocated budget in chaitra? or</p>
<p>
will it wait for next month.</p>
<p>
</p>
<p>
</p>
<p>
</p>
<p>
<strong> Happy trading……..!!!!!!!</strong></p>
<p>
</p>
<p>
</p>
',
'published' => true,
'created' => '2019-03-08',
'modified' => '2019-03-08',
'keywords' => '',
'description' => '',
'sortorder' => '9986',
'image' => '20190308062910_march 8 pic 2.jpg',
'article_date' => '2019-03-08 00:00:00',
'homepage' => true,
'breaking_news' => false,
'main_news' => false,
'in_scroller' => false,
'user_id' => '22'
),
'ArticleCategory' => array(
'id' => '1',
'name' => 'NEWS',
'parentOf' => '0',
'published' => true,
'registered' => '2015-07-20 00:00:00',
'sortorder' => '158',
'del_flag' => '0',
'homepage' => true,
'display_in_menu' => true,
'user_id' => '1',
'created' => '0000-00-00 00:00:00',
'modified' => '2018-11-22 11:58:49'
),
'User' => array(
'password' => '*****',
'id' => '22',
'user_detail_id' => '1',
'group_id' => '24',
'username' => 'kishor.bam@newbusinessage.com',
'name' => '',
'email' => 'kishor.bam@newbusinessage.com',
'address' => '',
'gender' => '',
'access' => '1',
'phone' => '',
'access_type' => '0',
'activated' => false,
'sortorder' => '0',
'published' => '0',
'created' => '2018-11-30 10:47:22',
'last_login' => '2019-06-09 10:32:40',
'ip' => '202.63.242.112'
),
'ArticleComment' => array(),
'ArticleFeature' => array(),
'ArticleHasAuthor' => array(),
'ArticleHasTag' => array(),
'ArticleView' => array(
(int) 0 => array(
'article_id' => '10220',
'hit' => '1290'
)
),
'Slider' => array()
)
$current_user = null
$logged_in = false
$xml = false
simplexml_load_file - [internal], line ??
include - APP/View/Elements/side_bar.ctp, line 133
View::_evaluate() - CORE/Cake/View/View.php, line 971
View::_render() - CORE/Cake/View/View.php, line 933
View::_renderElement() - CORE/Cake/View/View.php, line 1224
View::element() - CORE/Cake/View/View.php, line 418
include - APP/View/Articles/view.ctp, line 391
View::_evaluate() - CORE/Cake/View/View.php, line 971
View::_render() - CORE/Cake/View/View.php, line 933
View::render() - CORE/Cake/View/View.php, line 473
Controller::render() - CORE/Cake/Controller/Controller.php, line 968
Dispatcher::_invoke() - CORE/Cake/Routing/Dispatcher.php, line 200
Dispatcher::dispatch() - CORE/Cake/Routing/Dispatcher.php, line 167
[main] - APP/webroot/index.php, line 117