$user = $this->Session->read('Auth.User');
//find the group of logged user
$groupId = $user['Group']['id'];
$viewFile = '/var/www/html/newbusinessage.com/app/View/Articles/view.ctp'
$dataForView = array(
'article' => array(
'Article' => array(
'id' => '10083',
'article_category_id' => '1',
'title' => 'Weekly Analysis ',
'sub_title' => '',
'summary' => 'While analyzing the trading volume an anomaly could be observed.',
'content' => '<p>
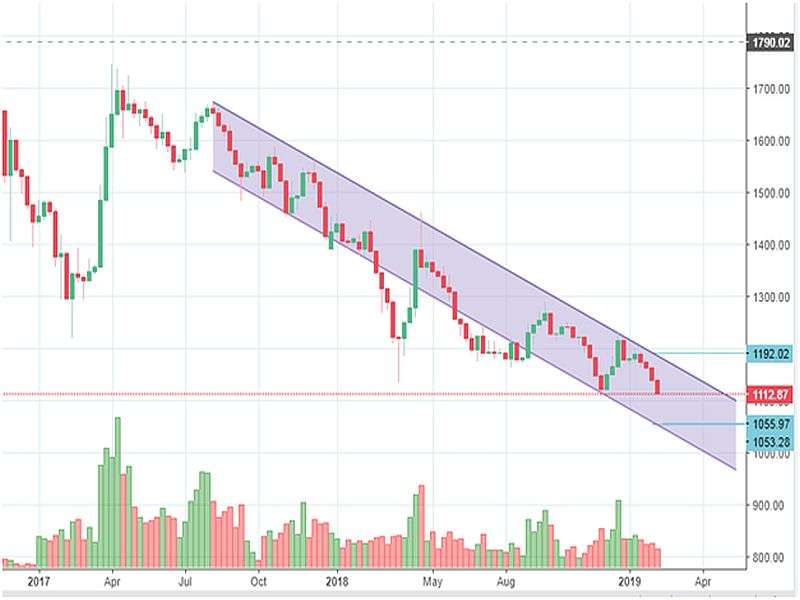
<strong> </strong>Chart 1. Nepse Weekly Candle stick pattern</p>
<p>
<strong>Nepse Index CMP: 1112.87 Anticipated Range for next week: 1098.51 to 1126.51</strong></p>
<p>
<strong>The pivot table for</strong></p>
<table align="left" border="1" cellpadding="0" cellspacing="0" style="width:658px;" width="658">
<tbody>
<tr>
<td style="width:94px;height:23px;">
<p>
<strong>S3</strong></p>
</td>
<td style="width:94px;height:23px;">
<p>
<strong>S2</strong></p>
</td>
<td style="width:94px;height:23px;">
<p>
<strong>S1</strong></p>
</td>
<td style="width:88px;height:23px;">
<p>
<strong>Pivot</strong></p>
</td>
<td style="width:96px;height:23px;">
<p>
<strong>R1</strong></p>
</td>
<td style="width:96px;height:23px;">
<p>
<strong>R2</strong></p>
</td>
<td style="width:96px;height:23px;">
<p>
<strong>R3</strong></p>
</td>
</tr>
<tr>
<td style="width:94px;height:23px;">
<p>
1075.30</p>
</td>
<td style="width:94px;height:23px;">
<p>
1093.72</p>
</td>
<td style="width:94px;height:23px;">
<p>
1103.30</p>
</td>
<td style="width:88px;height:23px;">
<p>
<strong>1121.72</strong></p>
</td>
<td style="width:96px;height:23px;">
<p>
1131.30</p>
</td>
<td style="width:96px;height:23px;">
<p>
1149.72</p>
</td>
<td style="width:96px;height:23px;">
<p>
1159.30</p>
</td>
</tr>
</tbody>
</table>
<p>
</p>
<p>
</p>
<p>
</p>
<p>
</p>
<p>
This week (Magh 27<sup>th</sup> to Falgun 2<sup>nd</sup>) trading volume: Rs 303.74 crores/ Rs 111.98 Crores</p>
<p>
Last week’s (Magh 20<sup>th</sup> to 24<sup>th</sup>) trading volume: Rs 150.45 Crores</p>
<p>
<strong>The Trading volume:</strong></p>
<p>
While analyzing the trading volume an anomaly could be observed. That is this week’s trading volume seems too higher compared to the previous week, this is because of the weekly last day a big volume of scrips EBL promoter share has been traded in market to make a total of Rs 303.74 for the week. If this particular trade is excluded then the average weekly transaction volume should be Rs 111.98 crores. So this puts the anomaly to market as the first figure is greater than the last week trading volume while the second figure is lower than the last week trading volume which Is Rs150.45 crores. In the first case, the volume should be indicated as bearish volume while in second case the volume is not bearish. If the bearish volume dominates the market then further price slide is expected and if not then saturation with support is expected.</p>
<p>
<strong>Candle sticks Pattern:</strong></p>
<p>
While observing Nepse weekly candle stick (Chart 1), if market sustains current level and bounce back above next week’s pivot with rise in volume then double bottom candle stick pattern is formed and the market should go up. But if current level is not sustained and market slides blow current level then further medium sized slides are ahead.</p>
<p>
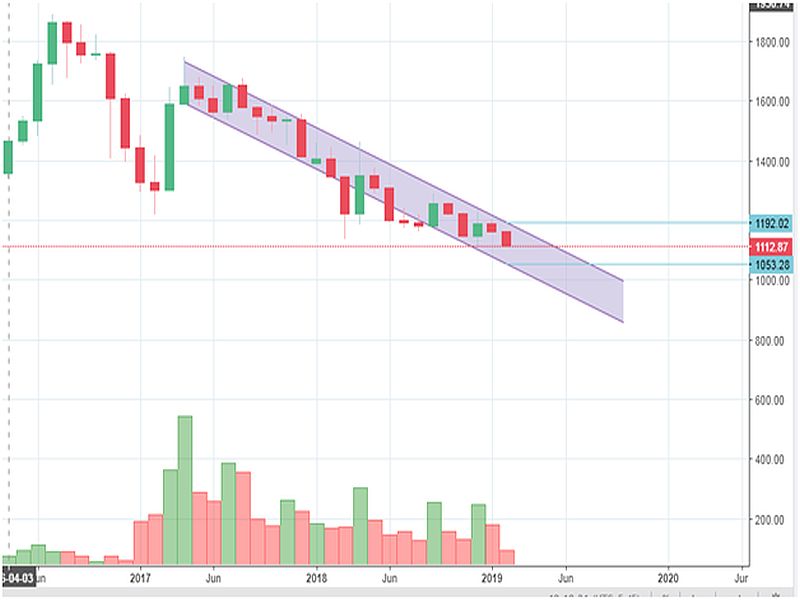
Monthly candle stick pattern also suggests the market with the same support level as weekly. Chart 2 illustrates the monthly candle stick chart.</p>
<p>
<strong>Fundamental Analysis:</strong></p>
<ol>
<li>
1. The 3<sup>rd</sup> quarter of the fiscal year has begun. The financial statements of optimum company havebeen already published and that is mixed.</li>
<li>
2.There are few companies whose profit ratio has risen but their prices are over sold. So these scrips are good for buying at current level and its best if the price further slides.</li>
<li style="text-align: justify;">
3.Economic indicators show the twin deficits as foe viz. Trade deficits and current account deficits. We have been facing the trade deficits for quite long but since recent past we have also been facing current account deficits which should be addressed by government policy.</li>
<li>
4.The risk of the twin deficits have been averse by the remittance ( GNP) in short term. That is good but how long?</li>
<li>
5.The foreign reserve is satisfactory though.</li>
<li>
6.GDP forecast is approx. 6 pc</li>
</ol>
<p>
</p>
<p>
</p>
<p>
<img alt="" src="/app/webroot/userfiles/images/2%2816%29.jpg" style="width: 800px; height: 600px;" /></p>
<p>
Chart : Nepse monthly candle stick pattern</p>
<p>
Happy Trading………!!!!!!!</p>
<p>
<strong>The pivot table for tomorrow (5<sup>th </sup>falgun)</strong></p>
<table border="1" cellpadding="1" cellspacing="1" style="width: 500px">
<tbody>
<tr>
<td>
<strong>S3</strong></td>
<td>
<strong>S2</strong></td>
<td>
<strong>S1</strong></td>
<td>
<strong>P</strong></td>
<td>
<strong>R1</strong></td>
<td>
<strong>R2</strong></td>
<td>
<strong>R3</strong></td>
</tr>
<tr>
<td>
<strong style="text-align: center;">1099.993</strong></td>
<td>
<strong style="text-align: center;">1106.10</strong></td>
<td>
<strong style="text-align: center;">1109.48333</strong></td>
<td>
<strong style="text-align: center;">1115.59</strong></td>
<td>
<strong style="text-align: center;">1118.973</strong></td>
<td>
<strong style="text-align: center;">1125.08</strong></td>
<td>
<strong style="text-align: center;">1128.463</strong></td>
</tr>
</tbody>
</table>
<p>
<strong>Turnover table:</strong></p>
<p>
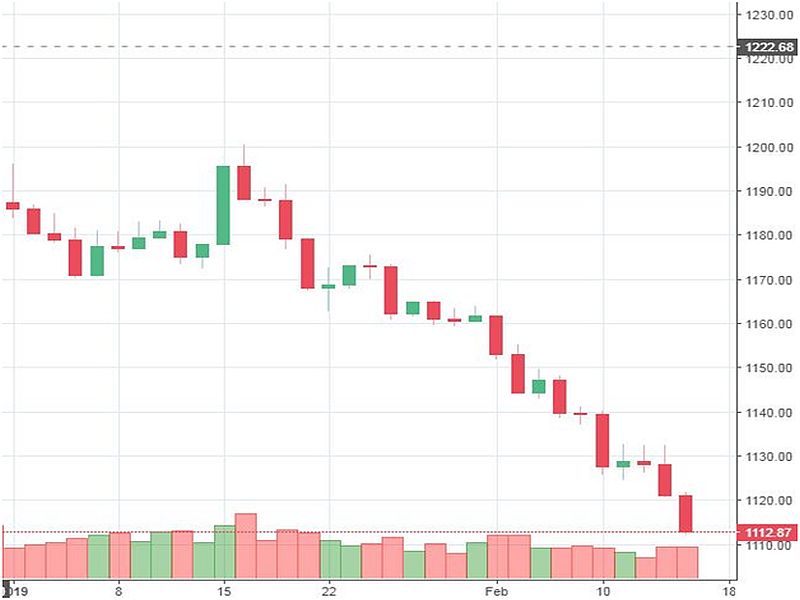
<strong>Today’s (2<sup>nd</sup>falgun) volume : Rs 216.65 corers/ Rs. 191.76 corers</strong></p>
<p>
<strong>Yesterdays (1<sup>st</sup>falgun) volume : Rs 23.88 corers</strong></p>
<p>
</p>
<p>
<strong><img alt="" src="/app/webroot/userfiles/images/3%2815%29.jpg" style="width: 800px; height: 600px;" /></strong></p>
<p>
Chart: NEPSE Daily Candle stick </p>
',
'published' => true,
'created' => '2019-02-15',
'modified' => '2019-02-15',
'keywords' => '',
'description' => '',
'sortorder' => '9850',
'image' => '20190215055323_1.jpg',
'article_date' => '2019-02-15 00:00:00',
'homepage' => true,
'breaking_news' => false,
'main_news' => false,
'in_scroller' => false,
'user_id' => '22'
),
'ArticleCategory' => array(
'id' => '1',
'name' => 'NEWS',
'parentOf' => '0',
'published' => true,
'registered' => '2015-07-20 00:00:00',
'sortorder' => '158',
'del_flag' => '0',
'homepage' => true,
'display_in_menu' => true,
'user_id' => '1',
'created' => '0000-00-00 00:00:00',
'modified' => '2018-11-22 11:58:49'
),
'User' => array(
'password' => '*****',
'id' => '22',
'user_detail_id' => '1',
'group_id' => '24',
'username' => 'kishor.bam@newbusinessage.com',
'name' => '',
'email' => 'kishor.bam@newbusinessage.com',
'address' => '',
'gender' => '',
'access' => '1',
'phone' => '',
'access_type' => '0',
'activated' => false,
'sortorder' => '0',
'published' => '0',
'created' => '2018-11-30 10:47:22',
'last_login' => '2019-06-09 10:32:40',
'ip' => '202.63.242.112'
),
'ArticleComment' => array(),
'ArticleFeature' => array(),
'ArticleHasAuthor' => array(),
'ArticleHasTag' => array(),
'ArticleView' => array(
(int) 0 => array(
[maximum depth reached]
)
),
'Slider' => array()
),
'current_user' => null,
'logged_in' => false
)
$article = array(
'Article' => array(
'id' => '10083',
'article_category_id' => '1',
'title' => 'Weekly Analysis ',
'sub_title' => '',
'summary' => 'While analyzing the trading volume an anomaly could be observed.',
'content' => '<p>
<strong> </strong>Chart 1. Nepse Weekly Candle stick pattern</p>
<p>
<strong>Nepse Index CMP: 1112.87 Anticipated Range for next week: 1098.51 to 1126.51</strong></p>
<p>
<strong>The pivot table for</strong></p>
<table align="left" border="1" cellpadding="0" cellspacing="0" style="width:658px;" width="658">
<tbody>
<tr>
<td style="width:94px;height:23px;">
<p>
<strong>S3</strong></p>
</td>
<td style="width:94px;height:23px;">
<p>
<strong>S2</strong></p>
</td>
<td style="width:94px;height:23px;">
<p>
<strong>S1</strong></p>
</td>
<td style="width:88px;height:23px;">
<p>
<strong>Pivot</strong></p>
</td>
<td style="width:96px;height:23px;">
<p>
<strong>R1</strong></p>
</td>
<td style="width:96px;height:23px;">
<p>
<strong>R2</strong></p>
</td>
<td style="width:96px;height:23px;">
<p>
<strong>R3</strong></p>
</td>
</tr>
<tr>
<td style="width:94px;height:23px;">
<p>
1075.30</p>
</td>
<td style="width:94px;height:23px;">
<p>
1093.72</p>
</td>
<td style="width:94px;height:23px;">
<p>
1103.30</p>
</td>
<td style="width:88px;height:23px;">
<p>
<strong>1121.72</strong></p>
</td>
<td style="width:96px;height:23px;">
<p>
1131.30</p>
</td>
<td style="width:96px;height:23px;">
<p>
1149.72</p>
</td>
<td style="width:96px;height:23px;">
<p>
1159.30</p>
</td>
</tr>
</tbody>
</table>
<p>
</p>
<p>
</p>
<p>
</p>
<p>
</p>
<p>
This week (Magh 27<sup>th</sup> to Falgun 2<sup>nd</sup>) trading volume: Rs 303.74 crores/ Rs 111.98 Crores</p>
<p>
Last week’s (Magh 20<sup>th</sup> to 24<sup>th</sup>) trading volume: Rs 150.45 Crores</p>
<p>
<strong>The Trading volume:</strong></p>
<p>
While analyzing the trading volume an anomaly could be observed. That is this week’s trading volume seems too higher compared to the previous week, this is because of the weekly last day a big volume of scrips EBL promoter share has been traded in market to make a total of Rs 303.74 for the week. If this particular trade is excluded then the average weekly transaction volume should be Rs 111.98 crores. So this puts the anomaly to market as the first figure is greater than the last week trading volume while the second figure is lower than the last week trading volume which Is Rs150.45 crores. In the first case, the volume should be indicated as bearish volume while in second case the volume is not bearish. If the bearish volume dominates the market then further price slide is expected and if not then saturation with support is expected.</p>
<p>
<strong>Candle sticks Pattern:</strong></p>
<p>
While observing Nepse weekly candle stick (Chart 1), if market sustains current level and bounce back above next week’s pivot with rise in volume then double bottom candle stick pattern is formed and the market should go up. But if current level is not sustained and market slides blow current level then further medium sized slides are ahead.</p>
<p>
Monthly candle stick pattern also suggests the market with the same support level as weekly. Chart 2 illustrates the monthly candle stick chart.</p>
<p>
<strong>Fundamental Analysis:</strong></p>
<ol>
<li>
1. The 3<sup>rd</sup> quarter of the fiscal year has begun. The financial statements of optimum company havebeen already published and that is mixed.</li>
<li>
2.There are few companies whose profit ratio has risen but their prices are over sold. So these scrips are good for buying at current level and its best if the price further slides.</li>
<li style="text-align: justify;">
3.Economic indicators show the twin deficits as foe viz. Trade deficits and current account deficits. We have been facing the trade deficits for quite long but since recent past we have also been facing current account deficits which should be addressed by government policy.</li>
<li>
4.The risk of the twin deficits have been averse by the remittance ( GNP) in short term. That is good but how long?</li>
<li>
5.The foreign reserve is satisfactory though.</li>
<li>
6.GDP forecast is approx. 6 pc</li>
</ol>
<p>
</p>
<p>
</p>
<p>
<img alt="" src="/app/webroot/userfiles/images/2%2816%29.jpg" style="width: 800px; height: 600px;" /></p>
<p>
Chart : Nepse monthly candle stick pattern</p>
<p>
Happy Trading………!!!!!!!</p>
<p>
<strong>The pivot table for tomorrow (5<sup>th </sup>falgun)</strong></p>
<table border="1" cellpadding="1" cellspacing="1" style="width: 500px">
<tbody>
<tr>
<td>
<strong>S3</strong></td>
<td>
<strong>S2</strong></td>
<td>
<strong>S1</strong></td>
<td>
<strong>P</strong></td>
<td>
<strong>R1</strong></td>
<td>
<strong>R2</strong></td>
<td>
<strong>R3</strong></td>
</tr>
<tr>
<td>
<strong style="text-align: center;">1099.993</strong></td>
<td>
<strong style="text-align: center;">1106.10</strong></td>
<td>
<strong style="text-align: center;">1109.48333</strong></td>
<td>
<strong style="text-align: center;">1115.59</strong></td>
<td>
<strong style="text-align: center;">1118.973</strong></td>
<td>
<strong style="text-align: center;">1125.08</strong></td>
<td>
<strong style="text-align: center;">1128.463</strong></td>
</tr>
</tbody>
</table>
<p>
<strong>Turnover table:</strong></p>
<p>
<strong>Today’s (2<sup>nd</sup>falgun) volume : Rs 216.65 corers/ Rs. 191.76 corers</strong></p>
<p>
<strong>Yesterdays (1<sup>st</sup>falgun) volume : Rs 23.88 corers</strong></p>
<p>
</p>
<p>
<strong><img alt="" src="/app/webroot/userfiles/images/3%2815%29.jpg" style="width: 800px; height: 600px;" /></strong></p>
<p>
Chart: NEPSE Daily Candle stick </p>
',
'published' => true,
'created' => '2019-02-15',
'modified' => '2019-02-15',
'keywords' => '',
'description' => '',
'sortorder' => '9850',
'image' => '20190215055323_1.jpg',
'article_date' => '2019-02-15 00:00:00',
'homepage' => true,
'breaking_news' => false,
'main_news' => false,
'in_scroller' => false,
'user_id' => '22'
),
'ArticleCategory' => array(
'id' => '1',
'name' => 'NEWS',
'parentOf' => '0',
'published' => true,
'registered' => '2015-07-20 00:00:00',
'sortorder' => '158',
'del_flag' => '0',
'homepage' => true,
'display_in_menu' => true,
'user_id' => '1',
'created' => '0000-00-00 00:00:00',
'modified' => '2018-11-22 11:58:49'
),
'User' => array(
'password' => '*****',
'id' => '22',
'user_detail_id' => '1',
'group_id' => '24',
'username' => 'kishor.bam@newbusinessage.com',
'name' => '',
'email' => 'kishor.bam@newbusinessage.com',
'address' => '',
'gender' => '',
'access' => '1',
'phone' => '',
'access_type' => '0',
'activated' => false,
'sortorder' => '0',
'published' => '0',
'created' => '2018-11-30 10:47:22',
'last_login' => '2019-06-09 10:32:40',
'ip' => '202.63.242.112'
),
'ArticleComment' => array(),
'ArticleFeature' => array(),
'ArticleHasAuthor' => array(),
'ArticleHasTag' => array(),
'ArticleView' => array(
(int) 0 => array(
'article_id' => '10083',
'hit' => '1059'
)
),
'Slider' => array()
)
$current_user = null
$logged_in = false
$image = 'https://www.old.newbusinessage.com/app/webroot/img/news/20190215055323_1.jpg'
$user = null
include - APP/View/Articles/view.ctp, line 115
View::_evaluate() - CORE/Cake/View/View.php, line 971
View::_render() - CORE/Cake/View/View.php, line 933
View::render() - CORE/Cake/View/View.php, line 473
Controller::render() - CORE/Cake/Controller/Controller.php, line 968
Dispatcher::_invoke() - CORE/Cake/Routing/Dispatcher.php, line 200
Dispatcher::dispatch() - CORE/Cake/Routing/Dispatcher.php, line 167
[main] - APP/webroot/index.php, line 117
Notice (8): Trying to access array offset on value of type null [APP/View/Articles/view.ctp, line 115]
$user = $this->Session->read('Auth.User');
//find the group of logged user
$groupId = $user['Group']['id'];
$viewFile = '/var/www/html/newbusinessage.com/app/View/Articles/view.ctp'
$dataForView = array(
'article' => array(
'Article' => array(
'id' => '10083',
'article_category_id' => '1',
'title' => 'Weekly Analysis ',
'sub_title' => '',
'summary' => 'While analyzing the trading volume an anomaly could be observed.',
'content' => '<p>
<strong> </strong>Chart 1. Nepse Weekly Candle stick pattern</p>
<p>
<strong>Nepse Index CMP: 1112.87 Anticipated Range for next week: 1098.51 to 1126.51</strong></p>
<p>
<strong>The pivot table for</strong></p>
<table align="left" border="1" cellpadding="0" cellspacing="0" style="width:658px;" width="658">
<tbody>
<tr>
<td style="width:94px;height:23px;">
<p>
<strong>S3</strong></p>
</td>
<td style="width:94px;height:23px;">
<p>
<strong>S2</strong></p>
</td>
<td style="width:94px;height:23px;">
<p>
<strong>S1</strong></p>
</td>
<td style="width:88px;height:23px;">
<p>
<strong>Pivot</strong></p>
</td>
<td style="width:96px;height:23px;">
<p>
<strong>R1</strong></p>
</td>
<td style="width:96px;height:23px;">
<p>
<strong>R2</strong></p>
</td>
<td style="width:96px;height:23px;">
<p>
<strong>R3</strong></p>
</td>
</tr>
<tr>
<td style="width:94px;height:23px;">
<p>
1075.30</p>
</td>
<td style="width:94px;height:23px;">
<p>
1093.72</p>
</td>
<td style="width:94px;height:23px;">
<p>
1103.30</p>
</td>
<td style="width:88px;height:23px;">
<p>
<strong>1121.72</strong></p>
</td>
<td style="width:96px;height:23px;">
<p>
1131.30</p>
</td>
<td style="width:96px;height:23px;">
<p>
1149.72</p>
</td>
<td style="width:96px;height:23px;">
<p>
1159.30</p>
</td>
</tr>
</tbody>
</table>
<p>
</p>
<p>
</p>
<p>
</p>
<p>
</p>
<p>
This week (Magh 27<sup>th</sup> to Falgun 2<sup>nd</sup>) trading volume: Rs 303.74 crores/ Rs 111.98 Crores</p>
<p>
Last week’s (Magh 20<sup>th</sup> to 24<sup>th</sup>) trading volume: Rs 150.45 Crores</p>
<p>
<strong>The Trading volume:</strong></p>
<p>
While analyzing the trading volume an anomaly could be observed. That is this week’s trading volume seems too higher compared to the previous week, this is because of the weekly last day a big volume of scrips EBL promoter share has been traded in market to make a total of Rs 303.74 for the week. If this particular trade is excluded then the average weekly transaction volume should be Rs 111.98 crores. So this puts the anomaly to market as the first figure is greater than the last week trading volume while the second figure is lower than the last week trading volume which Is Rs150.45 crores. In the first case, the volume should be indicated as bearish volume while in second case the volume is not bearish. If the bearish volume dominates the market then further price slide is expected and if not then saturation with support is expected.</p>
<p>
<strong>Candle sticks Pattern:</strong></p>
<p>
While observing Nepse weekly candle stick (Chart 1), if market sustains current level and bounce back above next week’s pivot with rise in volume then double bottom candle stick pattern is formed and the market should go up. But if current level is not sustained and market slides blow current level then further medium sized slides are ahead.</p>
<p>
Monthly candle stick pattern also suggests the market with the same support level as weekly. Chart 2 illustrates the monthly candle stick chart.</p>
<p>
<strong>Fundamental Analysis:</strong></p>
<ol>
<li>
1. The 3<sup>rd</sup> quarter of the fiscal year has begun. The financial statements of optimum company havebeen already published and that is mixed.</li>
<li>
2.There are few companies whose profit ratio has risen but their prices are over sold. So these scrips are good for buying at current level and its best if the price further slides.</li>
<li style="text-align: justify;">
3.Economic indicators show the twin deficits as foe viz. Trade deficits and current account deficits. We have been facing the trade deficits for quite long but since recent past we have also been facing current account deficits which should be addressed by government policy.</li>
<li>
4.The risk of the twin deficits have been averse by the remittance ( GNP) in short term. That is good but how long?</li>
<li>
5.The foreign reserve is satisfactory though.</li>
<li>
6.GDP forecast is approx. 6 pc</li>
</ol>
<p>
</p>
<p>
</p>
<p>
<img alt="" src="/app/webroot/userfiles/images/2%2816%29.jpg" style="width: 800px; height: 600px;" /></p>
<p>
Chart : Nepse monthly candle stick pattern</p>
<p>
Happy Trading………!!!!!!!</p>
<p>
<strong>The pivot table for tomorrow (5<sup>th </sup>falgun)</strong></p>
<table border="1" cellpadding="1" cellspacing="1" style="width: 500px">
<tbody>
<tr>
<td>
<strong>S3</strong></td>
<td>
<strong>S2</strong></td>
<td>
<strong>S1</strong></td>
<td>
<strong>P</strong></td>
<td>
<strong>R1</strong></td>
<td>
<strong>R2</strong></td>
<td>
<strong>R3</strong></td>
</tr>
<tr>
<td>
<strong style="text-align: center;">1099.993</strong></td>
<td>
<strong style="text-align: center;">1106.10</strong></td>
<td>
<strong style="text-align: center;">1109.48333</strong></td>
<td>
<strong style="text-align: center;">1115.59</strong></td>
<td>
<strong style="text-align: center;">1118.973</strong></td>
<td>
<strong style="text-align: center;">1125.08</strong></td>
<td>
<strong style="text-align: center;">1128.463</strong></td>
</tr>
</tbody>
</table>
<p>
<strong>Turnover table:</strong></p>
<p>
<strong>Today’s (2<sup>nd</sup>falgun) volume : Rs 216.65 corers/ Rs. 191.76 corers</strong></p>
<p>
<strong>Yesterdays (1<sup>st</sup>falgun) volume : Rs 23.88 corers</strong></p>
<p>
</p>
<p>
<strong><img alt="" src="/app/webroot/userfiles/images/3%2815%29.jpg" style="width: 800px; height: 600px;" /></strong></p>
<p>
Chart: NEPSE Daily Candle stick </p>
',
'published' => true,
'created' => '2019-02-15',
'modified' => '2019-02-15',
'keywords' => '',
'description' => '',
'sortorder' => '9850',
'image' => '20190215055323_1.jpg',
'article_date' => '2019-02-15 00:00:00',
'homepage' => true,
'breaking_news' => false,
'main_news' => false,
'in_scroller' => false,
'user_id' => '22'
),
'ArticleCategory' => array(
'id' => '1',
'name' => 'NEWS',
'parentOf' => '0',
'published' => true,
'registered' => '2015-07-20 00:00:00',
'sortorder' => '158',
'del_flag' => '0',
'homepage' => true,
'display_in_menu' => true,
'user_id' => '1',
'created' => '0000-00-00 00:00:00',
'modified' => '2018-11-22 11:58:49'
),
'User' => array(
'password' => '*****',
'id' => '22',
'user_detail_id' => '1',
'group_id' => '24',
'username' => 'kishor.bam@newbusinessage.com',
'name' => '',
'email' => 'kishor.bam@newbusinessage.com',
'address' => '',
'gender' => '',
'access' => '1',
'phone' => '',
'access_type' => '0',
'activated' => false,
'sortorder' => '0',
'published' => '0',
'created' => '2018-11-30 10:47:22',
'last_login' => '2019-06-09 10:32:40',
'ip' => '202.63.242.112'
),
'ArticleComment' => array(),
'ArticleFeature' => array(),
'ArticleHasAuthor' => array(),
'ArticleHasTag' => array(),
'ArticleView' => array(
(int) 0 => array(
[maximum depth reached]
)
),
'Slider' => array()
),
'current_user' => null,
'logged_in' => false
)
$article = array(
'Article' => array(
'id' => '10083',
'article_category_id' => '1',
'title' => 'Weekly Analysis ',
'sub_title' => '',
'summary' => 'While analyzing the trading volume an anomaly could be observed.',
'content' => '<p>
<strong> </strong>Chart 1. Nepse Weekly Candle stick pattern</p>
<p>
<strong>Nepse Index CMP: 1112.87 Anticipated Range for next week: 1098.51 to 1126.51</strong></p>
<p>
<strong>The pivot table for</strong></p>
<table align="left" border="1" cellpadding="0" cellspacing="0" style="width:658px;" width="658">
<tbody>
<tr>
<td style="width:94px;height:23px;">
<p>
<strong>S3</strong></p>
</td>
<td style="width:94px;height:23px;">
<p>
<strong>S2</strong></p>
</td>
<td style="width:94px;height:23px;">
<p>
<strong>S1</strong></p>
</td>
<td style="width:88px;height:23px;">
<p>
<strong>Pivot</strong></p>
</td>
<td style="width:96px;height:23px;">
<p>
<strong>R1</strong></p>
</td>
<td style="width:96px;height:23px;">
<p>
<strong>R2</strong></p>
</td>
<td style="width:96px;height:23px;">
<p>
<strong>R3</strong></p>
</td>
</tr>
<tr>
<td style="width:94px;height:23px;">
<p>
1075.30</p>
</td>
<td style="width:94px;height:23px;">
<p>
1093.72</p>
</td>
<td style="width:94px;height:23px;">
<p>
1103.30</p>
</td>
<td style="width:88px;height:23px;">
<p>
<strong>1121.72</strong></p>
</td>
<td style="width:96px;height:23px;">
<p>
1131.30</p>
</td>
<td style="width:96px;height:23px;">
<p>
1149.72</p>
</td>
<td style="width:96px;height:23px;">
<p>
1159.30</p>
</td>
</tr>
</tbody>
</table>
<p>
</p>
<p>
</p>
<p>
</p>
<p>
</p>
<p>
This week (Magh 27<sup>th</sup> to Falgun 2<sup>nd</sup>) trading volume: Rs 303.74 crores/ Rs 111.98 Crores</p>
<p>
Last week’s (Magh 20<sup>th</sup> to 24<sup>th</sup>) trading volume: Rs 150.45 Crores</p>
<p>
<strong>The Trading volume:</strong></p>
<p>
While analyzing the trading volume an anomaly could be observed. That is this week’s trading volume seems too higher compared to the previous week, this is because of the weekly last day a big volume of scrips EBL promoter share has been traded in market to make a total of Rs 303.74 for the week. If this particular trade is excluded then the average weekly transaction volume should be Rs 111.98 crores. So this puts the anomaly to market as the first figure is greater than the last week trading volume while the second figure is lower than the last week trading volume which Is Rs150.45 crores. In the first case, the volume should be indicated as bearish volume while in second case the volume is not bearish. If the bearish volume dominates the market then further price slide is expected and if not then saturation with support is expected.</p>
<p>
<strong>Candle sticks Pattern:</strong></p>
<p>
While observing Nepse weekly candle stick (Chart 1), if market sustains current level and bounce back above next week’s pivot with rise in volume then double bottom candle stick pattern is formed and the market should go up. But if current level is not sustained and market slides blow current level then further medium sized slides are ahead.</p>
<p>
Monthly candle stick pattern also suggests the market with the same support level as weekly. Chart 2 illustrates the monthly candle stick chart.</p>
<p>
<strong>Fundamental Analysis:</strong></p>
<ol>
<li>
1. The 3<sup>rd</sup> quarter of the fiscal year has begun. The financial statements of optimum company havebeen already published and that is mixed.</li>
<li>
2.There are few companies whose profit ratio has risen but their prices are over sold. So these scrips are good for buying at current level and its best if the price further slides.</li>
<li style="text-align: justify;">
3.Economic indicators show the twin deficits as foe viz. Trade deficits and current account deficits. We have been facing the trade deficits for quite long but since recent past we have also been facing current account deficits which should be addressed by government policy.</li>
<li>
4.The risk of the twin deficits have been averse by the remittance ( GNP) in short term. That is good but how long?</li>
<li>
5.The foreign reserve is satisfactory though.</li>
<li>
6.GDP forecast is approx. 6 pc</li>
</ol>
<p>
</p>
<p>
</p>
<p>
<img alt="" src="/app/webroot/userfiles/images/2%2816%29.jpg" style="width: 800px; height: 600px;" /></p>
<p>
Chart : Nepse monthly candle stick pattern</p>
<p>
Happy Trading………!!!!!!!</p>
<p>
<strong>The pivot table for tomorrow (5<sup>th </sup>falgun)</strong></p>
<table border="1" cellpadding="1" cellspacing="1" style="width: 500px">
<tbody>
<tr>
<td>
<strong>S3</strong></td>
<td>
<strong>S2</strong></td>
<td>
<strong>S1</strong></td>
<td>
<strong>P</strong></td>
<td>
<strong>R1</strong></td>
<td>
<strong>R2</strong></td>
<td>
<strong>R3</strong></td>
</tr>
<tr>
<td>
<strong style="text-align: center;">1099.993</strong></td>
<td>
<strong style="text-align: center;">1106.10</strong></td>
<td>
<strong style="text-align: center;">1109.48333</strong></td>
<td>
<strong style="text-align: center;">1115.59</strong></td>
<td>
<strong style="text-align: center;">1118.973</strong></td>
<td>
<strong style="text-align: center;">1125.08</strong></td>
<td>
<strong style="text-align: center;">1128.463</strong></td>
</tr>
</tbody>
</table>
<p>
<strong>Turnover table:</strong></p>
<p>
<strong>Today’s (2<sup>nd</sup>falgun) volume : Rs 216.65 corers/ Rs. 191.76 corers</strong></p>
<p>
<strong>Yesterdays (1<sup>st</sup>falgun) volume : Rs 23.88 corers</strong></p>
<p>
</p>
<p>
<strong><img alt="" src="/app/webroot/userfiles/images/3%2815%29.jpg" style="width: 800px; height: 600px;" /></strong></p>
<p>
Chart: NEPSE Daily Candle stick </p>
',
'published' => true,
'created' => '2019-02-15',
'modified' => '2019-02-15',
'keywords' => '',
'description' => '',
'sortorder' => '9850',
'image' => '20190215055323_1.jpg',
'article_date' => '2019-02-15 00:00:00',
'homepage' => true,
'breaking_news' => false,
'main_news' => false,
'in_scroller' => false,
'user_id' => '22'
),
'ArticleCategory' => array(
'id' => '1',
'name' => 'NEWS',
'parentOf' => '0',
'published' => true,
'registered' => '2015-07-20 00:00:00',
'sortorder' => '158',
'del_flag' => '0',
'homepage' => true,
'display_in_menu' => true,
'user_id' => '1',
'created' => '0000-00-00 00:00:00',
'modified' => '2018-11-22 11:58:49'
),
'User' => array(
'password' => '*****',
'id' => '22',
'user_detail_id' => '1',
'group_id' => '24',
'username' => 'kishor.bam@newbusinessage.com',
'name' => '',
'email' => 'kishor.bam@newbusinessage.com',
'address' => '',
'gender' => '',
'access' => '1',
'phone' => '',
'access_type' => '0',
'activated' => false,
'sortorder' => '0',
'published' => '0',
'created' => '2018-11-30 10:47:22',
'last_login' => '2019-06-09 10:32:40',
'ip' => '202.63.242.112'
),
'ArticleComment' => array(),
'ArticleFeature' => array(),
'ArticleHasAuthor' => array(),
'ArticleHasTag' => array(),
'ArticleView' => array(
(int) 0 => array(
'article_id' => '10083',
'hit' => '1059'
)
),
'Slider' => array()
)
$current_user = null
$logged_in = false
$image = 'https://www.old.newbusinessage.com/app/webroot/img/news/20190215055323_1.jpg'
$user = null
include - APP/View/Articles/view.ctp, line 115
View::_evaluate() - CORE/Cake/View/View.php, line 971
View::_render() - CORE/Cake/View/View.php, line 933
View::render() - CORE/Cake/View/View.php, line 473
Controller::render() - CORE/Cake/Controller/Controller.php, line 968
Dispatcher::_invoke() - CORE/Cake/Routing/Dispatcher.php, line 200
Dispatcher::dispatch() - CORE/Cake/Routing/Dispatcher.php, line 167
[main] - APP/webroot/index.php, line 117
Notice (8): Trying to access array offset on value of type null [APP/View/Articles/view.ctp, line 116]
//find the group of logged user
$groupId = $user['Group']['id'];
$user_id=$user["id"];
$viewFile = '/var/www/html/newbusinessage.com/app/View/Articles/view.ctp'
$dataForView = array(
'article' => array(
'Article' => array(
'id' => '10083',
'article_category_id' => '1',
'title' => 'Weekly Analysis ',
'sub_title' => '',
'summary' => 'While analyzing the trading volume an anomaly could be observed.',
'content' => '<p>
<strong> </strong>Chart 1. Nepse Weekly Candle stick pattern</p>
<p>
<strong>Nepse Index CMP: 1112.87 Anticipated Range for next week: 1098.51 to 1126.51</strong></p>
<p>
<strong>The pivot table for</strong></p>
<table align="left" border="1" cellpadding="0" cellspacing="0" style="width:658px;" width="658">
<tbody>
<tr>
<td style="width:94px;height:23px;">
<p>
<strong>S3</strong></p>
</td>
<td style="width:94px;height:23px;">
<p>
<strong>S2</strong></p>
</td>
<td style="width:94px;height:23px;">
<p>
<strong>S1</strong></p>
</td>
<td style="width:88px;height:23px;">
<p>
<strong>Pivot</strong></p>
</td>
<td style="width:96px;height:23px;">
<p>
<strong>R1</strong></p>
</td>
<td style="width:96px;height:23px;">
<p>
<strong>R2</strong></p>
</td>
<td style="width:96px;height:23px;">
<p>
<strong>R3</strong></p>
</td>
</tr>
<tr>
<td style="width:94px;height:23px;">
<p>
1075.30</p>
</td>
<td style="width:94px;height:23px;">
<p>
1093.72</p>
</td>
<td style="width:94px;height:23px;">
<p>
1103.30</p>
</td>
<td style="width:88px;height:23px;">
<p>
<strong>1121.72</strong></p>
</td>
<td style="width:96px;height:23px;">
<p>
1131.30</p>
</td>
<td style="width:96px;height:23px;">
<p>
1149.72</p>
</td>
<td style="width:96px;height:23px;">
<p>
1159.30</p>
</td>
</tr>
</tbody>
</table>
<p>
</p>
<p>
</p>
<p>
</p>
<p>
</p>
<p>
This week (Magh 27<sup>th</sup> to Falgun 2<sup>nd</sup>) trading volume: Rs 303.74 crores/ Rs 111.98 Crores</p>
<p>
Last week’s (Magh 20<sup>th</sup> to 24<sup>th</sup>) trading volume: Rs 150.45 Crores</p>
<p>
<strong>The Trading volume:</strong></p>
<p>
While analyzing the trading volume an anomaly could be observed. That is this week’s trading volume seems too higher compared to the previous week, this is because of the weekly last day a big volume of scrips EBL promoter share has been traded in market to make a total of Rs 303.74 for the week. If this particular trade is excluded then the average weekly transaction volume should be Rs 111.98 crores. So this puts the anomaly to market as the first figure is greater than the last week trading volume while the second figure is lower than the last week trading volume which Is Rs150.45 crores. In the first case, the volume should be indicated as bearish volume while in second case the volume is not bearish. If the bearish volume dominates the market then further price slide is expected and if not then saturation with support is expected.</p>
<p>
<strong>Candle sticks Pattern:</strong></p>
<p>
While observing Nepse weekly candle stick (Chart 1), if market sustains current level and bounce back above next week’s pivot with rise in volume then double bottom candle stick pattern is formed and the market should go up. But if current level is not sustained and market slides blow current level then further medium sized slides are ahead.</p>
<p>
Monthly candle stick pattern also suggests the market with the same support level as weekly. Chart 2 illustrates the monthly candle stick chart.</p>
<p>
<strong>Fundamental Analysis:</strong></p>
<ol>
<li>
1. The 3<sup>rd</sup> quarter of the fiscal year has begun. The financial statements of optimum company havebeen already published and that is mixed.</li>
<li>
2.There are few companies whose profit ratio has risen but their prices are over sold. So these scrips are good for buying at current level and its best if the price further slides.</li>
<li style="text-align: justify;">
3.Economic indicators show the twin deficits as foe viz. Trade deficits and current account deficits. We have been facing the trade deficits for quite long but since recent past we have also been facing current account deficits which should be addressed by government policy.</li>
<li>
4.The risk of the twin deficits have been averse by the remittance ( GNP) in short term. That is good but how long?</li>
<li>
5.The foreign reserve is satisfactory though.</li>
<li>
6.GDP forecast is approx. 6 pc</li>
</ol>
<p>
</p>
<p>
</p>
<p>
<img alt="" src="/app/webroot/userfiles/images/2%2816%29.jpg" style="width: 800px; height: 600px;" /></p>
<p>
Chart : Nepse monthly candle stick pattern</p>
<p>
Happy Trading………!!!!!!!</p>
<p>
<strong>The pivot table for tomorrow (5<sup>th </sup>falgun)</strong></p>
<table border="1" cellpadding="1" cellspacing="1" style="width: 500px">
<tbody>
<tr>
<td>
<strong>S3</strong></td>
<td>
<strong>S2</strong></td>
<td>
<strong>S1</strong></td>
<td>
<strong>P</strong></td>
<td>
<strong>R1</strong></td>
<td>
<strong>R2</strong></td>
<td>
<strong>R3</strong></td>
</tr>
<tr>
<td>
<strong style="text-align: center;">1099.993</strong></td>
<td>
<strong style="text-align: center;">1106.10</strong></td>
<td>
<strong style="text-align: center;">1109.48333</strong></td>
<td>
<strong style="text-align: center;">1115.59</strong></td>
<td>
<strong style="text-align: center;">1118.973</strong></td>
<td>
<strong style="text-align: center;">1125.08</strong></td>
<td>
<strong style="text-align: center;">1128.463</strong></td>
</tr>
</tbody>
</table>
<p>
<strong>Turnover table:</strong></p>
<p>
<strong>Today’s (2<sup>nd</sup>falgun) volume : Rs 216.65 corers/ Rs. 191.76 corers</strong></p>
<p>
<strong>Yesterdays (1<sup>st</sup>falgun) volume : Rs 23.88 corers</strong></p>
<p>
</p>
<p>
<strong><img alt="" src="/app/webroot/userfiles/images/3%2815%29.jpg" style="width: 800px; height: 600px;" /></strong></p>
<p>
Chart: NEPSE Daily Candle stick </p>
',
'published' => true,
'created' => '2019-02-15',
'modified' => '2019-02-15',
'keywords' => '',
'description' => '',
'sortorder' => '9850',
'image' => '20190215055323_1.jpg',
'article_date' => '2019-02-15 00:00:00',
'homepage' => true,
'breaking_news' => false,
'main_news' => false,
'in_scroller' => false,
'user_id' => '22'
),
'ArticleCategory' => array(
'id' => '1',
'name' => 'NEWS',
'parentOf' => '0',
'published' => true,
'registered' => '2015-07-20 00:00:00',
'sortorder' => '158',
'del_flag' => '0',
'homepage' => true,
'display_in_menu' => true,
'user_id' => '1',
'created' => '0000-00-00 00:00:00',
'modified' => '2018-11-22 11:58:49'
),
'User' => array(
'password' => '*****',
'id' => '22',
'user_detail_id' => '1',
'group_id' => '24',
'username' => 'kishor.bam@newbusinessage.com',
'name' => '',
'email' => 'kishor.bam@newbusinessage.com',
'address' => '',
'gender' => '',
'access' => '1',
'phone' => '',
'access_type' => '0',
'activated' => false,
'sortorder' => '0',
'published' => '0',
'created' => '2018-11-30 10:47:22',
'last_login' => '2019-06-09 10:32:40',
'ip' => '202.63.242.112'
),
'ArticleComment' => array(),
'ArticleFeature' => array(),
'ArticleHasAuthor' => array(),
'ArticleHasTag' => array(),
'ArticleView' => array(
(int) 0 => array(
[maximum depth reached]
)
),
'Slider' => array()
),
'current_user' => null,
'logged_in' => false
)
$article = array(
'Article' => array(
'id' => '10083',
'article_category_id' => '1',
'title' => 'Weekly Analysis ',
'sub_title' => '',
'summary' => 'While analyzing the trading volume an anomaly could be observed.',
'content' => '<p>
<strong> </strong>Chart 1. Nepse Weekly Candle stick pattern</p>
<p>
<strong>Nepse Index CMP: 1112.87 Anticipated Range for next week: 1098.51 to 1126.51</strong></p>
<p>
<strong>The pivot table for</strong></p>
<table align="left" border="1" cellpadding="0" cellspacing="0" style="width:658px;" width="658">
<tbody>
<tr>
<td style="width:94px;height:23px;">
<p>
<strong>S3</strong></p>
</td>
<td style="width:94px;height:23px;">
<p>
<strong>S2</strong></p>
</td>
<td style="width:94px;height:23px;">
<p>
<strong>S1</strong></p>
</td>
<td style="width:88px;height:23px;">
<p>
<strong>Pivot</strong></p>
</td>
<td style="width:96px;height:23px;">
<p>
<strong>R1</strong></p>
</td>
<td style="width:96px;height:23px;">
<p>
<strong>R2</strong></p>
</td>
<td style="width:96px;height:23px;">
<p>
<strong>R3</strong></p>
</td>
</tr>
<tr>
<td style="width:94px;height:23px;">
<p>
1075.30</p>
</td>
<td style="width:94px;height:23px;">
<p>
1093.72</p>
</td>
<td style="width:94px;height:23px;">
<p>
1103.30</p>
</td>
<td style="width:88px;height:23px;">
<p>
<strong>1121.72</strong></p>
</td>
<td style="width:96px;height:23px;">
<p>
1131.30</p>
</td>
<td style="width:96px;height:23px;">
<p>
1149.72</p>
</td>
<td style="width:96px;height:23px;">
<p>
1159.30</p>
</td>
</tr>
</tbody>
</table>
<p>
</p>
<p>
</p>
<p>
</p>
<p>
</p>
<p>
This week (Magh 27<sup>th</sup> to Falgun 2<sup>nd</sup>) trading volume: Rs 303.74 crores/ Rs 111.98 Crores</p>
<p>
Last week’s (Magh 20<sup>th</sup> to 24<sup>th</sup>) trading volume: Rs 150.45 Crores</p>
<p>
<strong>The Trading volume:</strong></p>
<p>
While analyzing the trading volume an anomaly could be observed. That is this week’s trading volume seems too higher compared to the previous week, this is because of the weekly last day a big volume of scrips EBL promoter share has been traded in market to make a total of Rs 303.74 for the week. If this particular trade is excluded then the average weekly transaction volume should be Rs 111.98 crores. So this puts the anomaly to market as the first figure is greater than the last week trading volume while the second figure is lower than the last week trading volume which Is Rs150.45 crores. In the first case, the volume should be indicated as bearish volume while in second case the volume is not bearish. If the bearish volume dominates the market then further price slide is expected and if not then saturation with support is expected.</p>
<p>
<strong>Candle sticks Pattern:</strong></p>
<p>
While observing Nepse weekly candle stick (Chart 1), if market sustains current level and bounce back above next week’s pivot with rise in volume then double bottom candle stick pattern is formed and the market should go up. But if current level is not sustained and market slides blow current level then further medium sized slides are ahead.</p>
<p>
Monthly candle stick pattern also suggests the market with the same support level as weekly. Chart 2 illustrates the monthly candle stick chart.</p>
<p>
<strong>Fundamental Analysis:</strong></p>
<ol>
<li>
1. The 3<sup>rd</sup> quarter of the fiscal year has begun. The financial statements of optimum company havebeen already published and that is mixed.</li>
<li>
2.There are few companies whose profit ratio has risen but their prices are over sold. So these scrips are good for buying at current level and its best if the price further slides.</li>
<li style="text-align: justify;">
3.Economic indicators show the twin deficits as foe viz. Trade deficits and current account deficits. We have been facing the trade deficits for quite long but since recent past we have also been facing current account deficits which should be addressed by government policy.</li>
<li>
4.The risk of the twin deficits have been averse by the remittance ( GNP) in short term. That is good but how long?</li>
<li>
5.The foreign reserve is satisfactory though.</li>
<li>
6.GDP forecast is approx. 6 pc</li>
</ol>
<p>
</p>
<p>
</p>
<p>
<img alt="" src="/app/webroot/userfiles/images/2%2816%29.jpg" style="width: 800px; height: 600px;" /></p>
<p>
Chart : Nepse monthly candle stick pattern</p>
<p>
Happy Trading………!!!!!!!</p>
<p>
<strong>The pivot table for tomorrow (5<sup>th </sup>falgun)</strong></p>
<table border="1" cellpadding="1" cellspacing="1" style="width: 500px">
<tbody>
<tr>
<td>
<strong>S3</strong></td>
<td>
<strong>S2</strong></td>
<td>
<strong>S1</strong></td>
<td>
<strong>P</strong></td>
<td>
<strong>R1</strong></td>
<td>
<strong>R2</strong></td>
<td>
<strong>R3</strong></td>
</tr>
<tr>
<td>
<strong style="text-align: center;">1099.993</strong></td>
<td>
<strong style="text-align: center;">1106.10</strong></td>
<td>
<strong style="text-align: center;">1109.48333</strong></td>
<td>
<strong style="text-align: center;">1115.59</strong></td>
<td>
<strong style="text-align: center;">1118.973</strong></td>
<td>
<strong style="text-align: center;">1125.08</strong></td>
<td>
<strong style="text-align: center;">1128.463</strong></td>
</tr>
</tbody>
</table>
<p>
<strong>Turnover table:</strong></p>
<p>
<strong>Today’s (2<sup>nd</sup>falgun) volume : Rs 216.65 corers/ Rs. 191.76 corers</strong></p>
<p>
<strong>Yesterdays (1<sup>st</sup>falgun) volume : Rs 23.88 corers</strong></p>
<p>
</p>
<p>
<strong><img alt="" src="/app/webroot/userfiles/images/3%2815%29.jpg" style="width: 800px; height: 600px;" /></strong></p>
<p>
Chart: NEPSE Daily Candle stick </p>
',
'published' => true,
'created' => '2019-02-15',
'modified' => '2019-02-15',
'keywords' => '',
'description' => '',
'sortorder' => '9850',
'image' => '20190215055323_1.jpg',
'article_date' => '2019-02-15 00:00:00',
'homepage' => true,
'breaking_news' => false,
'main_news' => false,
'in_scroller' => false,
'user_id' => '22'
),
'ArticleCategory' => array(
'id' => '1',
'name' => 'NEWS',
'parentOf' => '0',
'published' => true,
'registered' => '2015-07-20 00:00:00',
'sortorder' => '158',
'del_flag' => '0',
'homepage' => true,
'display_in_menu' => true,
'user_id' => '1',
'created' => '0000-00-00 00:00:00',
'modified' => '2018-11-22 11:58:49'
),
'User' => array(
'password' => '*****',
'id' => '22',
'user_detail_id' => '1',
'group_id' => '24',
'username' => 'kishor.bam@newbusinessage.com',
'name' => '',
'email' => 'kishor.bam@newbusinessage.com',
'address' => '',
'gender' => '',
'access' => '1',
'phone' => '',
'access_type' => '0',
'activated' => false,
'sortorder' => '0',
'published' => '0',
'created' => '2018-11-30 10:47:22',
'last_login' => '2019-06-09 10:32:40',
'ip' => '202.63.242.112'
),
'ArticleComment' => array(),
'ArticleFeature' => array(),
'ArticleHasAuthor' => array(),
'ArticleHasTag' => array(),
'ArticleView' => array(
(int) 0 => array(
'article_id' => '10083',
'hit' => '1059'
)
),
'Slider' => array()
)
$current_user = null
$logged_in = false
$image = 'https://www.old.newbusinessage.com/app/webroot/img/news/20190215055323_1.jpg'
$user = null
$groupId = null
include - APP/View/Articles/view.ctp, line 116
View::_evaluate() - CORE/Cake/View/View.php, line 971
View::_render() - CORE/Cake/View/View.php, line 933
View::render() - CORE/Cake/View/View.php, line 473
Controller::render() - CORE/Cake/Controller/Controller.php, line 968
Dispatcher::_invoke() - CORE/Cake/Routing/Dispatcher.php, line 200
Dispatcher::dispatch() - CORE/Cake/Routing/Dispatcher.php, line 167
[main] - APP/webroot/index.php, line 117
$viewFile = '/var/www/html/newbusinessage.com/app/View/Articles/view.ctp'
$dataForView = array(
'article' => array(
'Article' => array(
'id' => '10083',
'article_category_id' => '1',
'title' => 'Weekly Analysis ',
'sub_title' => '',
'summary' => 'While analyzing the trading volume an anomaly could be observed.',
'content' => '<p>
<strong> </strong>Chart 1. Nepse Weekly Candle stick pattern</p>
<p>
<strong>Nepse Index CMP: 1112.87 Anticipated Range for next week: 1098.51 to 1126.51</strong></p>
<p>
<strong>The pivot table for</strong></p>
<table align="left" border="1" cellpadding="0" cellspacing="0" style="width:658px;" width="658">
<tbody>
<tr>
<td style="width:94px;height:23px;">
<p>
<strong>S3</strong></p>
</td>
<td style="width:94px;height:23px;">
<p>
<strong>S2</strong></p>
</td>
<td style="width:94px;height:23px;">
<p>
<strong>S1</strong></p>
</td>
<td style="width:88px;height:23px;">
<p>
<strong>Pivot</strong></p>
</td>
<td style="width:96px;height:23px;">
<p>
<strong>R1</strong></p>
</td>
<td style="width:96px;height:23px;">
<p>
<strong>R2</strong></p>
</td>
<td style="width:96px;height:23px;">
<p>
<strong>R3</strong></p>
</td>
</tr>
<tr>
<td style="width:94px;height:23px;">
<p>
1075.30</p>
</td>
<td style="width:94px;height:23px;">
<p>
1093.72</p>
</td>
<td style="width:94px;height:23px;">
<p>
1103.30</p>
</td>
<td style="width:88px;height:23px;">
<p>
<strong>1121.72</strong></p>
</td>
<td style="width:96px;height:23px;">
<p>
1131.30</p>
</td>
<td style="width:96px;height:23px;">
<p>
1149.72</p>
</td>
<td style="width:96px;height:23px;">
<p>
1159.30</p>
</td>
</tr>
</tbody>
</table>
<p>
</p>
<p>
</p>
<p>
</p>
<p>
</p>
<p>
This week (Magh 27<sup>th</sup> to Falgun 2<sup>nd</sup>) trading volume: Rs 303.74 crores/ Rs 111.98 Crores</p>
<p>
Last week’s (Magh 20<sup>th</sup> to 24<sup>th</sup>) trading volume: Rs 150.45 Crores</p>
<p>
<strong>The Trading volume:</strong></p>
<p>
While analyzing the trading volume an anomaly could be observed. That is this week’s trading volume seems too higher compared to the previous week, this is because of the weekly last day a big volume of scrips EBL promoter share has been traded in market to make a total of Rs 303.74 for the week. If this particular trade is excluded then the average weekly transaction volume should be Rs 111.98 crores. So this puts the anomaly to market as the first figure is greater than the last week trading volume while the second figure is lower than the last week trading volume which Is Rs150.45 crores. In the first case, the volume should be indicated as bearish volume while in second case the volume is not bearish. If the bearish volume dominates the market then further price slide is expected and if not then saturation with support is expected.</p>
<p>
<strong>Candle sticks Pattern:</strong></p>
<p>
While observing Nepse weekly candle stick (Chart 1), if market sustains current level and bounce back above next week’s pivot with rise in volume then double bottom candle stick pattern is formed and the market should go up. But if current level is not sustained and market slides blow current level then further medium sized slides are ahead.</p>
<p>
Monthly candle stick pattern also suggests the market with the same support level as weekly. Chart 2 illustrates the monthly candle stick chart.</p>
<p>
<strong>Fundamental Analysis:</strong></p>
<ol>
<li>
1. The 3<sup>rd</sup> quarter of the fiscal year has begun. The financial statements of optimum company havebeen already published and that is mixed.</li>
<li>
2.There are few companies whose profit ratio has risen but their prices are over sold. So these scrips are good for buying at current level and its best if the price further slides.</li>
<li style="text-align: justify;">
3.Economic indicators show the twin deficits as foe viz. Trade deficits and current account deficits. We have been facing the trade deficits for quite long but since recent past we have also been facing current account deficits which should be addressed by government policy.</li>
<li>
4.The risk of the twin deficits have been averse by the remittance ( GNP) in short term. That is good but how long?</li>
<li>
5.The foreign reserve is satisfactory though.</li>
<li>
6.GDP forecast is approx. 6 pc</li>
</ol>
<p>
</p>
<p>
</p>
<p>
<img alt="" src="/app/webroot/userfiles/images/2%2816%29.jpg" style="width: 800px; height: 600px;" /></p>
<p>
Chart : Nepse monthly candle stick pattern</p>
<p>
Happy Trading………!!!!!!!</p>
<p>
<strong>The pivot table for tomorrow (5<sup>th </sup>falgun)</strong></p>
<table border="1" cellpadding="1" cellspacing="1" style="width: 500px">
<tbody>
<tr>
<td>
<strong>S3</strong></td>
<td>
<strong>S2</strong></td>
<td>
<strong>S1</strong></td>
<td>
<strong>P</strong></td>
<td>
<strong>R1</strong></td>
<td>
<strong>R2</strong></td>
<td>
<strong>R3</strong></td>
</tr>
<tr>
<td>
<strong style="text-align: center;">1099.993</strong></td>
<td>
<strong style="text-align: center;">1106.10</strong></td>
<td>
<strong style="text-align: center;">1109.48333</strong></td>
<td>
<strong style="text-align: center;">1115.59</strong></td>
<td>
<strong style="text-align: center;">1118.973</strong></td>
<td>
<strong style="text-align: center;">1125.08</strong></td>
<td>
<strong style="text-align: center;">1128.463</strong></td>
</tr>
</tbody>
</table>
<p>
<strong>Turnover table:</strong></p>
<p>
<strong>Today’s (2<sup>nd</sup>falgun) volume : Rs 216.65 corers/ Rs. 191.76 corers</strong></p>
<p>
<strong>Yesterdays (1<sup>st</sup>falgun) volume : Rs 23.88 corers</strong></p>
<p>
</p>
<p>
<strong><img alt="" src="/app/webroot/userfiles/images/3%2815%29.jpg" style="width: 800px; height: 600px;" /></strong></p>
<p>
Chart: NEPSE Daily Candle stick </p>
',
'published' => true,
'created' => '2019-02-15',
'modified' => '2019-02-15',
'keywords' => '',
'description' => '',
'sortorder' => '9850',
'image' => '20190215055323_1.jpg',
'article_date' => '2019-02-15 00:00:00',
'homepage' => true,
'breaking_news' => false,
'main_news' => false,
'in_scroller' => false,
'user_id' => '22'
),
'ArticleCategory' => array(
'id' => '1',
'name' => 'NEWS',
'parentOf' => '0',
'published' => true,
'registered' => '2015-07-20 00:00:00',
'sortorder' => '158',
'del_flag' => '0',
'homepage' => true,
'display_in_menu' => true,
'user_id' => '1',
'created' => '0000-00-00 00:00:00',
'modified' => '2018-11-22 11:58:49'
),
'User' => array(
'password' => '*****',
'id' => '22',
'user_detail_id' => '1',
'group_id' => '24',
'username' => 'kishor.bam@newbusinessage.com',
'name' => '',
'email' => 'kishor.bam@newbusinessage.com',
'address' => '',
'gender' => '',
'access' => '1',
'phone' => '',
'access_type' => '0',
'activated' => false,
'sortorder' => '0',
'published' => '0',
'created' => '2018-11-30 10:47:22',
'last_login' => '2019-06-09 10:32:40',
'ip' => '202.63.242.112'
),
'ArticleComment' => array(),
'ArticleFeature' => array(),
'ArticleHasAuthor' => array(),
'ArticleHasTag' => array(),
'ArticleView' => array(
(int) 0 => array(
[maximum depth reached]
)
),
'Slider' => array()
),
'current_user' => null,
'logged_in' => false
)
$article = array(
'Article' => array(
'id' => '10083',
'article_category_id' => '1',
'title' => 'Weekly Analysis ',
'sub_title' => '',
'summary' => 'While analyzing the trading volume an anomaly could be observed.',
'content' => '<p>
<strong> </strong>Chart 1. Nepse Weekly Candle stick pattern</p>
<p>
<strong>Nepse Index CMP: 1112.87 Anticipated Range for next week: 1098.51 to 1126.51</strong></p>
<p>
<strong>The pivot table for</strong></p>
<table align="left" border="1" cellpadding="0" cellspacing="0" style="width:658px;" width="658">
<tbody>
<tr>
<td style="width:94px;height:23px;">
<p>
<strong>S3</strong></p>
</td>
<td style="width:94px;height:23px;">
<p>
<strong>S2</strong></p>
</td>
<td style="width:94px;height:23px;">
<p>
<strong>S1</strong></p>
</td>
<td style="width:88px;height:23px;">
<p>
<strong>Pivot</strong></p>
</td>
<td style="width:96px;height:23px;">
<p>
<strong>R1</strong></p>
</td>
<td style="width:96px;height:23px;">
<p>
<strong>R2</strong></p>
</td>
<td style="width:96px;height:23px;">
<p>
<strong>R3</strong></p>
</td>
</tr>
<tr>
<td style="width:94px;height:23px;">
<p>
1075.30</p>
</td>
<td style="width:94px;height:23px;">
<p>
1093.72</p>
</td>
<td style="width:94px;height:23px;">
<p>
1103.30</p>
</td>
<td style="width:88px;height:23px;">
<p>
<strong>1121.72</strong></p>
</td>
<td style="width:96px;height:23px;">
<p>
1131.30</p>
</td>
<td style="width:96px;height:23px;">
<p>
1149.72</p>
</td>
<td style="width:96px;height:23px;">
<p>
1159.30</p>
</td>
</tr>
</tbody>
</table>
<p>
</p>
<p>
</p>
<p>
</p>
<p>
</p>
<p>
This week (Magh 27<sup>th</sup> to Falgun 2<sup>nd</sup>) trading volume: Rs 303.74 crores/ Rs 111.98 Crores</p>
<p>
Last week’s (Magh 20<sup>th</sup> to 24<sup>th</sup>) trading volume: Rs 150.45 Crores</p>
<p>
<strong>The Trading volume:</strong></p>
<p>
While analyzing the trading volume an anomaly could be observed. That is this week’s trading volume seems too higher compared to the previous week, this is because of the weekly last day a big volume of scrips EBL promoter share has been traded in market to make a total of Rs 303.74 for the week. If this particular trade is excluded then the average weekly transaction volume should be Rs 111.98 crores. So this puts the anomaly to market as the first figure is greater than the last week trading volume while the second figure is lower than the last week trading volume which Is Rs150.45 crores. In the first case, the volume should be indicated as bearish volume while in second case the volume is not bearish. If the bearish volume dominates the market then further price slide is expected and if not then saturation with support is expected.</p>
<p>
<strong>Candle sticks Pattern:</strong></p>
<p>
While observing Nepse weekly candle stick (Chart 1), if market sustains current level and bounce back above next week’s pivot with rise in volume then double bottom candle stick pattern is formed and the market should go up. But if current level is not sustained and market slides blow current level then further medium sized slides are ahead.</p>
<p>
Monthly candle stick pattern also suggests the market with the same support level as weekly. Chart 2 illustrates the monthly candle stick chart.</p>
<p>
<strong>Fundamental Analysis:</strong></p>
<ol>
<li>
1. The 3<sup>rd</sup> quarter of the fiscal year has begun. The financial statements of optimum company havebeen already published and that is mixed.</li>
<li>
2.There are few companies whose profit ratio has risen but their prices are over sold. So these scrips are good for buying at current level and its best if the price further slides.</li>
<li style="text-align: justify;">
3.Economic indicators show the twin deficits as foe viz. Trade deficits and current account deficits. We have been facing the trade deficits for quite long but since recent past we have also been facing current account deficits which should be addressed by government policy.</li>
<li>
4.The risk of the twin deficits have been averse by the remittance ( GNP) in short term. That is good but how long?</li>
<li>
5.The foreign reserve is satisfactory though.</li>
<li>
6.GDP forecast is approx. 6 pc</li>
</ol>
<p>
</p>
<p>
</p>
<p>
<img alt="" src="/app/webroot/userfiles/images/2%2816%29.jpg" style="width: 800px; height: 600px;" /></p>
<p>
Chart : Nepse monthly candle stick pattern</p>
<p>
Happy Trading………!!!!!!!</p>
<p>
<strong>The pivot table for tomorrow (5<sup>th </sup>falgun)</strong></p>
<table border="1" cellpadding="1" cellspacing="1" style="width: 500px">
<tbody>
<tr>
<td>
<strong>S3</strong></td>
<td>
<strong>S2</strong></td>
<td>
<strong>S1</strong></td>
<td>
<strong>P</strong></td>
<td>
<strong>R1</strong></td>
<td>
<strong>R2</strong></td>
<td>
<strong>R3</strong></td>
</tr>
<tr>
<td>
<strong style="text-align: center;">1099.993</strong></td>
<td>
<strong style="text-align: center;">1106.10</strong></td>
<td>
<strong style="text-align: center;">1109.48333</strong></td>
<td>
<strong style="text-align: center;">1115.59</strong></td>
<td>
<strong style="text-align: center;">1118.973</strong></td>
<td>
<strong style="text-align: center;">1125.08</strong></td>
<td>
<strong style="text-align: center;">1128.463</strong></td>
</tr>
</tbody>
</table>
<p>
<strong>Turnover table:</strong></p>
<p>
<strong>Today’s (2<sup>nd</sup>falgun) volume : Rs 216.65 corers/ Rs. 191.76 corers</strong></p>
<p>
<strong>Yesterdays (1<sup>st</sup>falgun) volume : Rs 23.88 corers</strong></p>
<p>
</p>
<p>
<strong><img alt="" src="/app/webroot/userfiles/images/3%2815%29.jpg" style="width: 800px; height: 600px;" /></strong></p>
<p>
Chart: NEPSE Daily Candle stick </p>
',
'published' => true,
'created' => '2019-02-15',
'modified' => '2019-02-15',
'keywords' => '',
'description' => '',
'sortorder' => '9850',
'image' => '20190215055323_1.jpg',
'article_date' => '2019-02-15 00:00:00',
'homepage' => true,
'breaking_news' => false,
'main_news' => false,
'in_scroller' => false,
'user_id' => '22'
),
'ArticleCategory' => array(
'id' => '1',
'name' => 'NEWS',
'parentOf' => '0',
'published' => true,
'registered' => '2015-07-20 00:00:00',
'sortorder' => '158',
'del_flag' => '0',
'homepage' => true,
'display_in_menu' => true,
'user_id' => '1',
'created' => '0000-00-00 00:00:00',
'modified' => '2018-11-22 11:58:49'
),
'User' => array(
'password' => '*****',
'id' => '22',
'user_detail_id' => '1',
'group_id' => '24',
'username' => 'kishor.bam@newbusinessage.com',
'name' => '',
'email' => 'kishor.bam@newbusinessage.com',
'address' => '',
'gender' => '',
'access' => '1',
'phone' => '',
'access_type' => '0',
'activated' => false,
'sortorder' => '0',
'published' => '0',
'created' => '2018-11-30 10:47:22',
'last_login' => '2019-06-09 10:32:40',
'ip' => '202.63.242.112'
),
'ArticleComment' => array(),
'ArticleFeature' => array(),
'ArticleHasAuthor' => array(),
'ArticleHasTag' => array(),
'ArticleView' => array(
(int) 0 => array(
'article_id' => '10083',
'hit' => '1059'
)
),
'Slider' => array()
)
$current_user = null
$logged_in = false
$image = 'https://www.old.newbusinessage.com/app/webroot/img/news/20190215055323_1.jpg'
$user = null
$groupId = null
$user_id = null
$date = '2019-02-15 00:00:00'
$dateFromDatabase = (int) 1550168100
$newDate = 'Feb 15, 2019'
$articleView = array(
'article_id' => '10083',
'hit' => '1059'
)
$word_count = (int) 947
$time_to_read = (float) 4.74
$time_to_read_min = (float) 4
$time_to_read_second = (float) 44
include - APP/View/Articles/view.ctp, line 241
View::_evaluate() - CORE/Cake/View/View.php, line 971
View::_render() - CORE/Cake/View/View.php, line 933
View::render() - CORE/Cake/View/View.php, line 473
Controller::render() - CORE/Cake/Controller/Controller.php, line 968
Dispatcher::_invoke() - CORE/Cake/Routing/Dispatcher.php, line 200
Dispatcher::dispatch() - CORE/Cake/Routing/Dispatcher.php, line 167
[main] - APP/webroot/index.php, line 117
Chart 1. Nepse Weekly Candle stick pattern
Nepse Index CMP: 1112.87 Anticipated Range for next week: 1098.51 to 1126.51
The pivot table for
S3
S2
S1
Pivot
R1
R2
R3
1075.30
1093.72
1103.30
1121.72
1131.30
1149.72
1159.30
This week (Magh 27th to Falgun 2nd) trading volume: Rs 303.74 crores/ Rs 111.98 Crores
Last week’s (Magh 20th to 24th) trading volume: Rs 150.45 Crores
The Trading volume:
While analyzing the trading volume an anomaly could be observed. That is this week’s trading volume seems too higher compared to the previous week, this is because of the weekly last day a big volume of scrips EBL promoter share has been traded in market to make a total of Rs 303.74 for the week. If this particular trade is excluded then the average weekly transaction volume should be Rs 111.98 crores. So this puts the anomaly to market as the first figure is greater than the last week trading volume while the second figure is lower than the last week trading volume which Is Rs150.45 crores. In the first case, the volume should be indicated as bearish volume while in second case the volume is not bearish. If the bearish volume dominates the market then further price slide is expected and if not then saturation with support is expected.
Candle sticks Pattern:
While observing Nepse weekly candle stick (Chart 1), if market sustains current level and bounce back above next week’s pivot with rise in volume then double bottom candle stick pattern is formed and the market should go up. But if current level is not sustained and market slides blow current level then further medium sized slides are ahead.
Monthly candle stick pattern also suggests the market with the same support level as weekly. Chart 2 illustrates the monthly candle stick chart.
Fundamental Analysis:
1. The 3rd quarter of the fiscal year has begun. The financial statements of optimum company havebeen already published and that is mixed.
2.There are few companies whose profit ratio has risen but their prices are over sold. So these scrips are good for buying at current level and its best if the price further slides.
3.Economic indicators show the twin deficits as foe viz. Trade deficits and current account deficits. We have been facing the trade deficits for quite long but since recent past we have also been facing current account deficits which should be addressed by government policy.
4.The risk of the twin deficits have been averse by the remittance ( GNP) in short term. That is good but how long?
FormHelper::create() - CORE/Cake/View/Helper/FormHelper.php, line 383
include - APP/View/Articles/view.ctp, line 273
View::_evaluate() - CORE/Cake/View/View.php, line 971
View::_render() - CORE/Cake/View/View.php, line 933
View::render() - CORE/Cake/View/View.php, line 473
Controller::render() - CORE/Cake/Controller/Controller.php, line 968
Dispatcher::_invoke() - CORE/Cake/Routing/Dispatcher.php, line 200
Dispatcher::dispatch() - CORE/Cake/Routing/Dispatcher.php, line 167
[main] - APP/webroot/index.php, line 117
$viewFile = '/var/www/html/newbusinessage.com/app/View/Elements/side_bar.ctp'
$dataForView = array(
'article' => array(
'Article' => array(
'id' => '10083',
'article_category_id' => '1',
'title' => 'Weekly Analysis ',
'sub_title' => '',
'summary' => 'While analyzing the trading volume an anomaly could be observed.',
'content' => '<p>
<strong> </strong>Chart 1. Nepse Weekly Candle stick pattern</p>
<p>
<strong>Nepse Index CMP: 1112.87 Anticipated Range for next week: 1098.51 to 1126.51</strong></p>
<p>
<strong>The pivot table for</strong></p>
<table align="left" border="1" cellpadding="0" cellspacing="0" style="width:658px;" width="658">
<tbody>
<tr>
<td style="width:94px;height:23px;">
<p>
<strong>S3</strong></p>
</td>
<td style="width:94px;height:23px;">
<p>
<strong>S2</strong></p>
</td>
<td style="width:94px;height:23px;">
<p>
<strong>S1</strong></p>
</td>
<td style="width:88px;height:23px;">
<p>
<strong>Pivot</strong></p>
</td>
<td style="width:96px;height:23px;">
<p>
<strong>R1</strong></p>
</td>
<td style="width:96px;height:23px;">
<p>
<strong>R2</strong></p>
</td>
<td style="width:96px;height:23px;">
<p>
<strong>R3</strong></p>
</td>
</tr>
<tr>
<td style="width:94px;height:23px;">
<p>
1075.30</p>
</td>
<td style="width:94px;height:23px;">
<p>
1093.72</p>
</td>
<td style="width:94px;height:23px;">
<p>
1103.30</p>
</td>
<td style="width:88px;height:23px;">
<p>
<strong>1121.72</strong></p>
</td>
<td style="width:96px;height:23px;">
<p>
1131.30</p>
</td>
<td style="width:96px;height:23px;">
<p>
1149.72</p>
</td>
<td style="width:96px;height:23px;">
<p>
1159.30</p>
</td>
</tr>
</tbody>
</table>
<p>
</p>
<p>
</p>
<p>
</p>
<p>
</p>
<p>
This week (Magh 27<sup>th</sup> to Falgun 2<sup>nd</sup>) trading volume: Rs 303.74 crores/ Rs 111.98 Crores</p>
<p>
Last week’s (Magh 20<sup>th</sup> to 24<sup>th</sup>) trading volume: Rs 150.45 Crores</p>
<p>
<strong>The Trading volume:</strong></p>
<p>
While analyzing the trading volume an anomaly could be observed. That is this week’s trading volume seems too higher compared to the previous week, this is because of the weekly last day a big volume of scrips EBL promoter share has been traded in market to make a total of Rs 303.74 for the week. If this particular trade is excluded then the average weekly transaction volume should be Rs 111.98 crores. So this puts the anomaly to market as the first figure is greater than the last week trading volume while the second figure is lower than the last week trading volume which Is Rs150.45 crores. In the first case, the volume should be indicated as bearish volume while in second case the volume is not bearish. If the bearish volume dominates the market then further price slide is expected and if not then saturation with support is expected.</p>
<p>
<strong>Candle sticks Pattern:</strong></p>
<p>
While observing Nepse weekly candle stick (Chart 1), if market sustains current level and bounce back above next week’s pivot with rise in volume then double bottom candle stick pattern is formed and the market should go up. But if current level is not sustained and market slides blow current level then further medium sized slides are ahead.</p>
<p>
Monthly candle stick pattern also suggests the market with the same support level as weekly. Chart 2 illustrates the monthly candle stick chart.</p>
<p>
<strong>Fundamental Analysis:</strong></p>
<ol>
<li>
1. The 3<sup>rd</sup> quarter of the fiscal year has begun. The financial statements of optimum company havebeen already published and that is mixed.</li>
<li>
2.There are few companies whose profit ratio has risen but their prices are over sold. So these scrips are good for buying at current level and its best if the price further slides.</li>
<li style="text-align: justify;">
3.Economic indicators show the twin deficits as foe viz. Trade deficits and current account deficits. We have been facing the trade deficits for quite long but since recent past we have also been facing current account deficits which should be addressed by government policy.</li>
<li>
4.The risk of the twin deficits have been averse by the remittance ( GNP) in short term. That is good but how long?</li>
<li>
5.The foreign reserve is satisfactory though.</li>
<li>
6.GDP forecast is approx. 6 pc</li>
</ol>
<p>
</p>
<p>
</p>
<p>
<img alt="" src="/app/webroot/userfiles/images/2%2816%29.jpg" style="width: 800px; height: 600px;" /></p>
<p>
Chart : Nepse monthly candle stick pattern</p>
<p>
Happy Trading………!!!!!!!</p>
<p>
<strong>The pivot table for tomorrow (5<sup>th </sup>falgun)</strong></p>
<table border="1" cellpadding="1" cellspacing="1" style="width: 500px">
<tbody>
<tr>
<td>
<strong>S3</strong></td>
<td>
<strong>S2</strong></td>
<td>
<strong>S1</strong></td>
<td>
<strong>P</strong></td>
<td>
<strong>R1</strong></td>
<td>
<strong>R2</strong></td>
<td>
<strong>R3</strong></td>
</tr>
<tr>
<td>
<strong style="text-align: center;">1099.993</strong></td>
<td>
<strong style="text-align: center;">1106.10</strong></td>
<td>
<strong style="text-align: center;">1109.48333</strong></td>
<td>
<strong style="text-align: center;">1115.59</strong></td>
<td>
<strong style="text-align: center;">1118.973</strong></td>
<td>
<strong style="text-align: center;">1125.08</strong></td>
<td>
<strong style="text-align: center;">1128.463</strong></td>
</tr>
</tbody>
</table>
<p>
<strong>Turnover table:</strong></p>
<p>
<strong>Today’s (2<sup>nd</sup>falgun) volume : Rs 216.65 corers/ Rs. 191.76 corers</strong></p>
<p>
<strong>Yesterdays (1<sup>st</sup>falgun) volume : Rs 23.88 corers</strong></p>
<p>
</p>
<p>
<strong><img alt="" src="/app/webroot/userfiles/images/3%2815%29.jpg" style="width: 800px; height: 600px;" /></strong></p>
<p>
Chart: NEPSE Daily Candle stick </p>
',
'published' => true,
'created' => '2019-02-15',
'modified' => '2019-02-15',
'keywords' => '',
'description' => '',
'sortorder' => '9850',
'image' => '20190215055323_1.jpg',
'article_date' => '2019-02-15 00:00:00',
'homepage' => true,
'breaking_news' => false,
'main_news' => false,
'in_scroller' => false,
'user_id' => '22'
),
'ArticleCategory' => array(
'id' => '1',
'name' => 'NEWS',
'parentOf' => '0',
'published' => true,
'registered' => '2015-07-20 00:00:00',
'sortorder' => '158',
'del_flag' => '0',
'homepage' => true,
'display_in_menu' => true,
'user_id' => '1',
'created' => '0000-00-00 00:00:00',
'modified' => '2018-11-22 11:58:49'
),
'User' => array(
'password' => '*****',
'id' => '22',
'user_detail_id' => '1',
'group_id' => '24',
'username' => 'kishor.bam@newbusinessage.com',
'name' => '',
'email' => 'kishor.bam@newbusinessage.com',
'address' => '',
'gender' => '',
'access' => '1',
'phone' => '',
'access_type' => '0',
'activated' => false,
'sortorder' => '0',
'published' => '0',
'created' => '2018-11-30 10:47:22',
'last_login' => '2019-06-09 10:32:40',
'ip' => '202.63.242.112'
),
'ArticleComment' => array(),
'ArticleFeature' => array(),
'ArticleHasAuthor' => array(),
'ArticleHasTag' => array(),
'ArticleView' => array(
(int) 0 => array(
[maximum depth reached]
)
),
'Slider' => array()
),
'current_user' => null,
'logged_in' => false
)
$article = array(
'Article' => array(
'id' => '10083',
'article_category_id' => '1',
'title' => 'Weekly Analysis ',
'sub_title' => '',
'summary' => 'While analyzing the trading volume an anomaly could be observed.',
'content' => '<p>
<strong> </strong>Chart 1. Nepse Weekly Candle stick pattern</p>
<p>
<strong>Nepse Index CMP: 1112.87 Anticipated Range for next week: 1098.51 to 1126.51</strong></p>
<p>
<strong>The pivot table for</strong></p>
<table align="left" border="1" cellpadding="0" cellspacing="0" style="width:658px;" width="658">
<tbody>
<tr>
<td style="width:94px;height:23px;">
<p>
<strong>S3</strong></p>
</td>
<td style="width:94px;height:23px;">
<p>
<strong>S2</strong></p>
</td>
<td style="width:94px;height:23px;">
<p>
<strong>S1</strong></p>
</td>
<td style="width:88px;height:23px;">
<p>
<strong>Pivot</strong></p>
</td>
<td style="width:96px;height:23px;">
<p>
<strong>R1</strong></p>
</td>
<td style="width:96px;height:23px;">
<p>
<strong>R2</strong></p>
</td>
<td style="width:96px;height:23px;">
<p>
<strong>R3</strong></p>
</td>
</tr>
<tr>
<td style="width:94px;height:23px;">
<p>
1075.30</p>
</td>
<td style="width:94px;height:23px;">
<p>
1093.72</p>
</td>
<td style="width:94px;height:23px;">
<p>
1103.30</p>
</td>
<td style="width:88px;height:23px;">
<p>
<strong>1121.72</strong></p>
</td>
<td style="width:96px;height:23px;">
<p>
1131.30</p>
</td>
<td style="width:96px;height:23px;">
<p>
1149.72</p>
</td>
<td style="width:96px;height:23px;">
<p>
1159.30</p>
</td>
</tr>
</tbody>
</table>
<p>
</p>
<p>
</p>
<p>
</p>
<p>
</p>
<p>
This week (Magh 27<sup>th</sup> to Falgun 2<sup>nd</sup>) trading volume: Rs 303.74 crores/ Rs 111.98 Crores</p>
<p>
Last week’s (Magh 20<sup>th</sup> to 24<sup>th</sup>) trading volume: Rs 150.45 Crores</p>
<p>
<strong>The Trading volume:</strong></p>
<p>
While analyzing the trading volume an anomaly could be observed. That is this week’s trading volume seems too higher compared to the previous week, this is because of the weekly last day a big volume of scrips EBL promoter share has been traded in market to make a total of Rs 303.74 for the week. If this particular trade is excluded then the average weekly transaction volume should be Rs 111.98 crores. So this puts the anomaly to market as the first figure is greater than the last week trading volume while the second figure is lower than the last week trading volume which Is Rs150.45 crores. In the first case, the volume should be indicated as bearish volume while in second case the volume is not bearish. If the bearish volume dominates the market then further price slide is expected and if not then saturation with support is expected.</p>
<p>
<strong>Candle sticks Pattern:</strong></p>
<p>
While observing Nepse weekly candle stick (Chart 1), if market sustains current level and bounce back above next week’s pivot with rise in volume then double bottom candle stick pattern is formed and the market should go up. But if current level is not sustained and market slides blow current level then further medium sized slides are ahead.</p>
<p>
Monthly candle stick pattern also suggests the market with the same support level as weekly. Chart 2 illustrates the monthly candle stick chart.</p>
<p>
<strong>Fundamental Analysis:</strong></p>
<ol>
<li>
1. The 3<sup>rd</sup> quarter of the fiscal year has begun. The financial statements of optimum company havebeen already published and that is mixed.</li>
<li>
2.There are few companies whose profit ratio has risen but their prices are over sold. So these scrips are good for buying at current level and its best if the price further slides.</li>
<li style="text-align: justify;">
3.Economic indicators show the twin deficits as foe viz. Trade deficits and current account deficits. We have been facing the trade deficits for quite long but since recent past we have also been facing current account deficits which should be addressed by government policy.</li>
<li>
4.The risk of the twin deficits have been averse by the remittance ( GNP) in short term. That is good but how long?</li>
<li>
5.The foreign reserve is satisfactory though.</li>
<li>
6.GDP forecast is approx. 6 pc</li>
</ol>
<p>
</p>
<p>
</p>
<p>
<img alt="" src="/app/webroot/userfiles/images/2%2816%29.jpg" style="width: 800px; height: 600px;" /></p>
<p>
Chart : Nepse monthly candle stick pattern</p>
<p>
Happy Trading………!!!!!!!</p>
<p>
<strong>The pivot table for tomorrow (5<sup>th </sup>falgun)</strong></p>
<table border="1" cellpadding="1" cellspacing="1" style="width: 500px">
<tbody>
<tr>
<td>
<strong>S3</strong></td>
<td>
<strong>S2</strong></td>
<td>
<strong>S1</strong></td>
<td>
<strong>P</strong></td>
<td>
<strong>R1</strong></td>
<td>
<strong>R2</strong></td>
<td>
<strong>R3</strong></td>
</tr>
<tr>
<td>
<strong style="text-align: center;">1099.993</strong></td>
<td>
<strong style="text-align: center;">1106.10</strong></td>
<td>
<strong style="text-align: center;">1109.48333</strong></td>
<td>
<strong style="text-align: center;">1115.59</strong></td>
<td>
<strong style="text-align: center;">1118.973</strong></td>
<td>
<strong style="text-align: center;">1125.08</strong></td>
<td>
<strong style="text-align: center;">1128.463</strong></td>
</tr>
</tbody>
</table>
<p>
<strong>Turnover table:</strong></p>
<p>
<strong>Today’s (2<sup>nd</sup>falgun) volume : Rs 216.65 corers/ Rs. 191.76 corers</strong></p>
<p>
<strong>Yesterdays (1<sup>st</sup>falgun) volume : Rs 23.88 corers</strong></p>
<p>
</p>
<p>
<strong><img alt="" src="/app/webroot/userfiles/images/3%2815%29.jpg" style="width: 800px; height: 600px;" /></strong></p>
<p>
Chart: NEPSE Daily Candle stick </p>
',
'published' => true,
'created' => '2019-02-15',
'modified' => '2019-02-15',
'keywords' => '',
'description' => '',
'sortorder' => '9850',
'image' => '20190215055323_1.jpg',
'article_date' => '2019-02-15 00:00:00',
'homepage' => true,
'breaking_news' => false,
'main_news' => false,
'in_scroller' => false,
'user_id' => '22'
),
'ArticleCategory' => array(
'id' => '1',
'name' => 'NEWS',
'parentOf' => '0',
'published' => true,
'registered' => '2015-07-20 00:00:00',
'sortorder' => '158',
'del_flag' => '0',
'homepage' => true,
'display_in_menu' => true,
'user_id' => '1',
'created' => '0000-00-00 00:00:00',
'modified' => '2018-11-22 11:58:49'
),
'User' => array(
'password' => '*****',
'id' => '22',
'user_detail_id' => '1',
'group_id' => '24',
'username' => 'kishor.bam@newbusinessage.com',
'name' => '',
'email' => 'kishor.bam@newbusinessage.com',
'address' => '',
'gender' => '',
'access' => '1',
'phone' => '',
'access_type' => '0',
'activated' => false,
'sortorder' => '0',
'published' => '0',
'created' => '2018-11-30 10:47:22',
'last_login' => '2019-06-09 10:32:40',
'ip' => '202.63.242.112'
),
'ArticleComment' => array(),
'ArticleFeature' => array(),
'ArticleHasAuthor' => array(),
'ArticleHasTag' => array(),
'ArticleView' => array(
(int) 0 => array(
'article_id' => '10083',
'hit' => '1059'
)
),
'Slider' => array()
)
$current_user = null
$logged_in = false
include - APP/View/Elements/side_bar.ctp, line 60
View::_evaluate() - CORE/Cake/View/View.php, line 971
View::_render() - CORE/Cake/View/View.php, line 933
View::_renderElement() - CORE/Cake/View/View.php, line 1224
View::element() - CORE/Cake/View/View.php, line 418
include - APP/View/Articles/view.ctp, line 391
View::_evaluate() - CORE/Cake/View/View.php, line 971
View::_render() - CORE/Cake/View/View.php, line 933
View::render() - CORE/Cake/View/View.php, line 473
Controller::render() - CORE/Cake/Controller/Controller.php, line 968
Dispatcher::_invoke() - CORE/Cake/Routing/Dispatcher.php, line 200
Dispatcher::dispatch() - CORE/Cake/Routing/Dispatcher.php, line 167
[main] - APP/webroot/index.php, line 117
Warning (2): simplexml_load_file() [<a href='http://php.net/function.simplexml-load-file'>function.simplexml-load-file</a>]: I/O warning : failed to load external entity "" [APP/View/Elements/side_bar.ctp, line 60]
$viewFile = '/var/www/html/newbusinessage.com/app/View/Elements/side_bar.ctp'
$dataForView = array(
'article' => array(
'Article' => array(
'id' => '10083',
'article_category_id' => '1',
'title' => 'Weekly Analysis ',
'sub_title' => '',
'summary' => 'While analyzing the trading volume an anomaly could be observed.',
'content' => '<p>
<strong> </strong>Chart 1. Nepse Weekly Candle stick pattern</p>
<p>
<strong>Nepse Index CMP: 1112.87 Anticipated Range for next week: 1098.51 to 1126.51</strong></p>
<p>
<strong>The pivot table for</strong></p>
<table align="left" border="1" cellpadding="0" cellspacing="0" style="width:658px;" width="658">
<tbody>
<tr>
<td style="width:94px;height:23px;">
<p>
<strong>S3</strong></p>
</td>
<td style="width:94px;height:23px;">
<p>
<strong>S2</strong></p>
</td>
<td style="width:94px;height:23px;">
<p>
<strong>S1</strong></p>
</td>
<td style="width:88px;height:23px;">
<p>
<strong>Pivot</strong></p>
</td>
<td style="width:96px;height:23px;">
<p>
<strong>R1</strong></p>
</td>
<td style="width:96px;height:23px;">
<p>
<strong>R2</strong></p>
</td>
<td style="width:96px;height:23px;">
<p>
<strong>R3</strong></p>
</td>
</tr>
<tr>
<td style="width:94px;height:23px;">
<p>
1075.30</p>
</td>
<td style="width:94px;height:23px;">
<p>
1093.72</p>
</td>
<td style="width:94px;height:23px;">
<p>
1103.30</p>
</td>
<td style="width:88px;height:23px;">
<p>
<strong>1121.72</strong></p>
</td>
<td style="width:96px;height:23px;">
<p>
1131.30</p>
</td>
<td style="width:96px;height:23px;">
<p>
1149.72</p>
</td>
<td style="width:96px;height:23px;">
<p>
1159.30</p>
</td>
</tr>
</tbody>
</table>
<p>
</p>
<p>
</p>
<p>
</p>
<p>
</p>
<p>
This week (Magh 27<sup>th</sup> to Falgun 2<sup>nd</sup>) trading volume: Rs 303.74 crores/ Rs 111.98 Crores</p>
<p>
Last week’s (Magh 20<sup>th</sup> to 24<sup>th</sup>) trading volume: Rs 150.45 Crores</p>
<p>
<strong>The Trading volume:</strong></p>
<p>
While analyzing the trading volume an anomaly could be observed. That is this week’s trading volume seems too higher compared to the previous week, this is because of the weekly last day a big volume of scrips EBL promoter share has been traded in market to make a total of Rs 303.74 for the week. If this particular trade is excluded then the average weekly transaction volume should be Rs 111.98 crores. So this puts the anomaly to market as the first figure is greater than the last week trading volume while the second figure is lower than the last week trading volume which Is Rs150.45 crores. In the first case, the volume should be indicated as bearish volume while in second case the volume is not bearish. If the bearish volume dominates the market then further price slide is expected and if not then saturation with support is expected.</p>
<p>
<strong>Candle sticks Pattern:</strong></p>
<p>
While observing Nepse weekly candle stick (Chart 1), if market sustains current level and bounce back above next week’s pivot with rise in volume then double bottom candle stick pattern is formed and the market should go up. But if current level is not sustained and market slides blow current level then further medium sized slides are ahead.</p>
<p>
Monthly candle stick pattern also suggests the market with the same support level as weekly. Chart 2 illustrates the monthly candle stick chart.</p>
<p>
<strong>Fundamental Analysis:</strong></p>
<ol>
<li>
1. The 3<sup>rd</sup> quarter of the fiscal year has begun. The financial statements of optimum company havebeen already published and that is mixed.</li>
<li>
2.There are few companies whose profit ratio has risen but their prices are over sold. So these scrips are good for buying at current level and its best if the price further slides.</li>
<li style="text-align: justify;">
3.Economic indicators show the twin deficits as foe viz. Trade deficits and current account deficits. We have been facing the trade deficits for quite long but since recent past we have also been facing current account deficits which should be addressed by government policy.</li>
<li>
4.The risk of the twin deficits have been averse by the remittance ( GNP) in short term. That is good but how long?</li>
<li>
5.The foreign reserve is satisfactory though.</li>
<li>
6.GDP forecast is approx. 6 pc</li>
</ol>
<p>
</p>
<p>
</p>
<p>
<img alt="" src="/app/webroot/userfiles/images/2%2816%29.jpg" style="width: 800px; height: 600px;" /></p>
<p>
Chart : Nepse monthly candle stick pattern</p>
<p>
Happy Trading………!!!!!!!</p>
<p>
<strong>The pivot table for tomorrow (5<sup>th </sup>falgun)</strong></p>
<table border="1" cellpadding="1" cellspacing="1" style="width: 500px">
<tbody>
<tr>
<td>
<strong>S3</strong></td>
<td>
<strong>S2</strong></td>
<td>
<strong>S1</strong></td>
<td>
<strong>P</strong></td>
<td>
<strong>R1</strong></td>
<td>
<strong>R2</strong></td>
<td>
<strong>R3</strong></td>
</tr>
<tr>
<td>
<strong style="text-align: center;">1099.993</strong></td>
<td>
<strong style="text-align: center;">1106.10</strong></td>
<td>
<strong style="text-align: center;">1109.48333</strong></td>
<td>
<strong style="text-align: center;">1115.59</strong></td>
<td>
<strong style="text-align: center;">1118.973</strong></td>
<td>
<strong style="text-align: center;">1125.08</strong></td>
<td>
<strong style="text-align: center;">1128.463</strong></td>
</tr>
</tbody>
</table>
<p>
<strong>Turnover table:</strong></p>
<p>
<strong>Today’s (2<sup>nd</sup>falgun) volume : Rs 216.65 corers/ Rs. 191.76 corers</strong></p>
<p>
<strong>Yesterdays (1<sup>st</sup>falgun) volume : Rs 23.88 corers</strong></p>
<p>
</p>
<p>
<strong><img alt="" src="/app/webroot/userfiles/images/3%2815%29.jpg" style="width: 800px; height: 600px;" /></strong></p>
<p>
Chart: NEPSE Daily Candle stick </p>
',
'published' => true,
'created' => '2019-02-15',
'modified' => '2019-02-15',
'keywords' => '',
'description' => '',
'sortorder' => '9850',
'image' => '20190215055323_1.jpg',
'article_date' => '2019-02-15 00:00:00',
'homepage' => true,
'breaking_news' => false,
'main_news' => false,
'in_scroller' => false,
'user_id' => '22'
),
'ArticleCategory' => array(
'id' => '1',
'name' => 'NEWS',
'parentOf' => '0',
'published' => true,
'registered' => '2015-07-20 00:00:00',
'sortorder' => '158',
'del_flag' => '0',
'homepage' => true,
'display_in_menu' => true,
'user_id' => '1',
'created' => '0000-00-00 00:00:00',
'modified' => '2018-11-22 11:58:49'
),
'User' => array(
'password' => '*****',
'id' => '22',
'user_detail_id' => '1',
'group_id' => '24',
'username' => 'kishor.bam@newbusinessage.com',
'name' => '',
'email' => 'kishor.bam@newbusinessage.com',
'address' => '',
'gender' => '',
'access' => '1',
'phone' => '',
'access_type' => '0',
'activated' => false,
'sortorder' => '0',
'published' => '0',
'created' => '2018-11-30 10:47:22',
'last_login' => '2019-06-09 10:32:40',
'ip' => '202.63.242.112'
),
'ArticleComment' => array(),
'ArticleFeature' => array(),
'ArticleHasAuthor' => array(),
'ArticleHasTag' => array(),
'ArticleView' => array(
(int) 0 => array(
[maximum depth reached]
)
),
'Slider' => array()
),
'current_user' => null,
'logged_in' => false
)
$article = array(
'Article' => array(
'id' => '10083',
'article_category_id' => '1',
'title' => 'Weekly Analysis ',
'sub_title' => '',
'summary' => 'While analyzing the trading volume an anomaly could be observed.',
'content' => '<p>
<strong> </strong>Chart 1. Nepse Weekly Candle stick pattern</p>
<p>
<strong>Nepse Index CMP: 1112.87 Anticipated Range for next week: 1098.51 to 1126.51</strong></p>
<p>
<strong>The pivot table for</strong></p>
<table align="left" border="1" cellpadding="0" cellspacing="0" style="width:658px;" width="658">
<tbody>
<tr>
<td style="width:94px;height:23px;">
<p>
<strong>S3</strong></p>
</td>
<td style="width:94px;height:23px;">
<p>
<strong>S2</strong></p>
</td>
<td style="width:94px;height:23px;">
<p>
<strong>S1</strong></p>
</td>
<td style="width:88px;height:23px;">
<p>
<strong>Pivot</strong></p>
</td>
<td style="width:96px;height:23px;">
<p>
<strong>R1</strong></p>
</td>
<td style="width:96px;height:23px;">
<p>
<strong>R2</strong></p>
</td>
<td style="width:96px;height:23px;">
<p>
<strong>R3</strong></p>
</td>
</tr>
<tr>
<td style="width:94px;height:23px;">
<p>
1075.30</p>
</td>
<td style="width:94px;height:23px;">
<p>
1093.72</p>
</td>
<td style="width:94px;height:23px;">
<p>
1103.30</p>
</td>
<td style="width:88px;height:23px;">
<p>
<strong>1121.72</strong></p>
</td>
<td style="width:96px;height:23px;">
<p>
1131.30</p>
</td>
<td style="width:96px;height:23px;">
<p>
1149.72</p>
</td>
<td style="width:96px;height:23px;">
<p>
1159.30</p>
</td>
</tr>
</tbody>
</table>
<p>
</p>
<p>
</p>
<p>
</p>
<p>
</p>
<p>
This week (Magh 27<sup>th</sup> to Falgun 2<sup>nd</sup>) trading volume: Rs 303.74 crores/ Rs 111.98 Crores</p>
<p>
Last week’s (Magh 20<sup>th</sup> to 24<sup>th</sup>) trading volume: Rs 150.45 Crores</p>
<p>
<strong>The Trading volume:</strong></p>
<p>
While analyzing the trading volume an anomaly could be observed. That is this week’s trading volume seems too higher compared to the previous week, this is because of the weekly last day a big volume of scrips EBL promoter share has been traded in market to make a total of Rs 303.74 for the week. If this particular trade is excluded then the average weekly transaction volume should be Rs 111.98 crores. So this puts the anomaly to market as the first figure is greater than the last week trading volume while the second figure is lower than the last week trading volume which Is Rs150.45 crores. In the first case, the volume should be indicated as bearish volume while in second case the volume is not bearish. If the bearish volume dominates the market then further price slide is expected and if not then saturation with support is expected.</p>
<p>
<strong>Candle sticks Pattern:</strong></p>
<p>
While observing Nepse weekly candle stick (Chart 1), if market sustains current level and bounce back above next week’s pivot with rise in volume then double bottom candle stick pattern is formed and the market should go up. But if current level is not sustained and market slides blow current level then further medium sized slides are ahead.</p>
<p>
Monthly candle stick pattern also suggests the market with the same support level as weekly. Chart 2 illustrates the monthly candle stick chart.</p>
<p>
<strong>Fundamental Analysis:</strong></p>
<ol>
<li>
1. The 3<sup>rd</sup> quarter of the fiscal year has begun. The financial statements of optimum company havebeen already published and that is mixed.</li>
<li>
2.There are few companies whose profit ratio has risen but their prices are over sold. So these scrips are good for buying at current level and its best if the price further slides.</li>
<li style="text-align: justify;">
3.Economic indicators show the twin deficits as foe viz. Trade deficits and current account deficits. We have been facing the trade deficits for quite long but since recent past we have also been facing current account deficits which should be addressed by government policy.</li>
<li>
4.The risk of the twin deficits have been averse by the remittance ( GNP) in short term. That is good but how long?</li>
<li>
5.The foreign reserve is satisfactory though.</li>
<li>
6.GDP forecast is approx. 6 pc</li>
</ol>
<p>
</p>
<p>
</p>
<p>
<img alt="" src="/app/webroot/userfiles/images/2%2816%29.jpg" style="width: 800px; height: 600px;" /></p>
<p>
Chart : Nepse monthly candle stick pattern</p>
<p>
Happy Trading………!!!!!!!</p>
<p>
<strong>The pivot table for tomorrow (5<sup>th </sup>falgun)</strong></p>
<table border="1" cellpadding="1" cellspacing="1" style="width: 500px">
<tbody>
<tr>
<td>
<strong>S3</strong></td>
<td>
<strong>S2</strong></td>
<td>
<strong>S1</strong></td>
<td>
<strong>P</strong></td>
<td>
<strong>R1</strong></td>
<td>
<strong>R2</strong></td>
<td>
<strong>R3</strong></td>
</tr>
<tr>
<td>
<strong style="text-align: center;">1099.993</strong></td>
<td>
<strong style="text-align: center;">1106.10</strong></td>
<td>
<strong style="text-align: center;">1109.48333</strong></td>
<td>
<strong style="text-align: center;">1115.59</strong></td>
<td>
<strong style="text-align: center;">1118.973</strong></td>
<td>
<strong style="text-align: center;">1125.08</strong></td>
<td>
<strong style="text-align: center;">1128.463</strong></td>
</tr>
</tbody>
</table>
<p>
<strong>Turnover table:</strong></p>
<p>
<strong>Today’s (2<sup>nd</sup>falgun) volume : Rs 216.65 corers/ Rs. 191.76 corers</strong></p>
<p>
<strong>Yesterdays (1<sup>st</sup>falgun) volume : Rs 23.88 corers</strong></p>
<p>
</p>
<p>
<strong><img alt="" src="/app/webroot/userfiles/images/3%2815%29.jpg" style="width: 800px; height: 600px;" /></strong></p>
<p>
Chart: NEPSE Daily Candle stick </p>
',
'published' => true,
'created' => '2019-02-15',
'modified' => '2019-02-15',
'keywords' => '',
'description' => '',
'sortorder' => '9850',
'image' => '20190215055323_1.jpg',
'article_date' => '2019-02-15 00:00:00',
'homepage' => true,
'breaking_news' => false,
'main_news' => false,
'in_scroller' => false,
'user_id' => '22'
),
'ArticleCategory' => array(
'id' => '1',
'name' => 'NEWS',
'parentOf' => '0',
'published' => true,
'registered' => '2015-07-20 00:00:00',
'sortorder' => '158',
'del_flag' => '0',
'homepage' => true,
'display_in_menu' => true,
'user_id' => '1',
'created' => '0000-00-00 00:00:00',
'modified' => '2018-11-22 11:58:49'
),
'User' => array(
'password' => '*****',
'id' => '22',
'user_detail_id' => '1',
'group_id' => '24',
'username' => 'kishor.bam@newbusinessage.com',
'name' => '',
'email' => 'kishor.bam@newbusinessage.com',
'address' => '',
'gender' => '',
'access' => '1',
'phone' => '',
'access_type' => '0',
'activated' => false,
'sortorder' => '0',
'published' => '0',
'created' => '2018-11-30 10:47:22',
'last_login' => '2019-06-09 10:32:40',
'ip' => '202.63.242.112'
),
'ArticleComment' => array(),
'ArticleFeature' => array(),
'ArticleHasAuthor' => array(),
'ArticleHasTag' => array(),
'ArticleView' => array(
(int) 0 => array(
'article_id' => '10083',
'hit' => '1059'
)
),
'Slider' => array()
)
$current_user = null
$logged_in = false
simplexml_load_file - [internal], line ??
include - APP/View/Elements/side_bar.ctp, line 60
View::_evaluate() - CORE/Cake/View/View.php, line 971
View::_render() - CORE/Cake/View/View.php, line 933
View::_renderElement() - CORE/Cake/View/View.php, line 1224
View::element() - CORE/Cake/View/View.php, line 418
include - APP/View/Articles/view.ctp, line 391
View::_evaluate() - CORE/Cake/View/View.php, line 971
View::_render() - CORE/Cake/View/View.php, line 933
View::render() - CORE/Cake/View/View.php, line 473
Controller::render() - CORE/Cake/Controller/Controller.php, line 968
Dispatcher::_invoke() - CORE/Cake/Routing/Dispatcher.php, line 200
Dispatcher::dispatch() - CORE/Cake/Routing/Dispatcher.php, line 167
[main] - APP/webroot/index.php, line 117
file not found!
Notice (8): Undefined variable: file [APP/View/Elements/side_bar.ctp, line 133]
$viewFile = '/var/www/html/newbusinessage.com/app/View/Elements/side_bar.ctp'
$dataForView = array(
'article' => array(
'Article' => array(
'id' => '10083',
'article_category_id' => '1',
'title' => 'Weekly Analysis ',
'sub_title' => '',
'summary' => 'While analyzing the trading volume an anomaly could be observed.',
'content' => '<p>
<strong> </strong>Chart 1. Nepse Weekly Candle stick pattern</p>
<p>
<strong>Nepse Index CMP: 1112.87 Anticipated Range for next week: 1098.51 to 1126.51</strong></p>
<p>
<strong>The pivot table for</strong></p>
<table align="left" border="1" cellpadding="0" cellspacing="0" style="width:658px;" width="658">
<tbody>
<tr>
<td style="width:94px;height:23px;">
<p>
<strong>S3</strong></p>
</td>
<td style="width:94px;height:23px;">
<p>
<strong>S2</strong></p>
</td>
<td style="width:94px;height:23px;">
<p>
<strong>S1</strong></p>
</td>
<td style="width:88px;height:23px;">
<p>
<strong>Pivot</strong></p>
</td>
<td style="width:96px;height:23px;">
<p>
<strong>R1</strong></p>
</td>
<td style="width:96px;height:23px;">
<p>
<strong>R2</strong></p>
</td>
<td style="width:96px;height:23px;">
<p>
<strong>R3</strong></p>
</td>
</tr>
<tr>
<td style="width:94px;height:23px;">
<p>
1075.30</p>
</td>
<td style="width:94px;height:23px;">
<p>
1093.72</p>
</td>
<td style="width:94px;height:23px;">
<p>
1103.30</p>
</td>
<td style="width:88px;height:23px;">
<p>
<strong>1121.72</strong></p>
</td>
<td style="width:96px;height:23px;">
<p>
1131.30</p>
</td>
<td style="width:96px;height:23px;">
<p>
1149.72</p>
</td>
<td style="width:96px;height:23px;">
<p>
1159.30</p>
</td>
</tr>
</tbody>
</table>
<p>
</p>
<p>
</p>
<p>
</p>
<p>
</p>
<p>
This week (Magh 27<sup>th</sup> to Falgun 2<sup>nd</sup>) trading volume: Rs 303.74 crores/ Rs 111.98 Crores</p>
<p>
Last week’s (Magh 20<sup>th</sup> to 24<sup>th</sup>) trading volume: Rs 150.45 Crores</p>
<p>
<strong>The Trading volume:</strong></p>
<p>
While analyzing the trading volume an anomaly could be observed. That is this week’s trading volume seems too higher compared to the previous week, this is because of the weekly last day a big volume of scrips EBL promoter share has been traded in market to make a total of Rs 303.74 for the week. If this particular trade is excluded then the average weekly transaction volume should be Rs 111.98 crores. So this puts the anomaly to market as the first figure is greater than the last week trading volume while the second figure is lower than the last week trading volume which Is Rs150.45 crores. In the first case, the volume should be indicated as bearish volume while in second case the volume is not bearish. If the bearish volume dominates the market then further price slide is expected and if not then saturation with support is expected.</p>
<p>
<strong>Candle sticks Pattern:</strong></p>
<p>
While observing Nepse weekly candle stick (Chart 1), if market sustains current level and bounce back above next week’s pivot with rise in volume then double bottom candle stick pattern is formed and the market should go up. But if current level is not sustained and market slides blow current level then further medium sized slides are ahead.</p>
<p>
Monthly candle stick pattern also suggests the market with the same support level as weekly. Chart 2 illustrates the monthly candle stick chart.</p>
<p>
<strong>Fundamental Analysis:</strong></p>
<ol>
<li>
1. The 3<sup>rd</sup> quarter of the fiscal year has begun. The financial statements of optimum company havebeen already published and that is mixed.</li>
<li>
2.There are few companies whose profit ratio has risen but their prices are over sold. So these scrips are good for buying at current level and its best if the price further slides.</li>
<li style="text-align: justify;">
3.Economic indicators show the twin deficits as foe viz. Trade deficits and current account deficits. We have been facing the trade deficits for quite long but since recent past we have also been facing current account deficits which should be addressed by government policy.</li>
<li>
4.The risk of the twin deficits have been averse by the remittance ( GNP) in short term. That is good but how long?</li>
<li>
5.The foreign reserve is satisfactory though.</li>
<li>
6.GDP forecast is approx. 6 pc</li>
</ol>
<p>
</p>
<p>
</p>
<p>
<img alt="" src="/app/webroot/userfiles/images/2%2816%29.jpg" style="width: 800px; height: 600px;" /></p>
<p>
Chart : Nepse monthly candle stick pattern</p>
<p>
Happy Trading………!!!!!!!</p>
<p>
<strong>The pivot table for tomorrow (5<sup>th </sup>falgun)</strong></p>
<table border="1" cellpadding="1" cellspacing="1" style="width: 500px">
<tbody>
<tr>
<td>
<strong>S3</strong></td>
<td>
<strong>S2</strong></td>
<td>
<strong>S1</strong></td>
<td>
<strong>P</strong></td>
<td>
<strong>R1</strong></td>
<td>
<strong>R2</strong></td>
<td>
<strong>R3</strong></td>
</tr>
<tr>
<td>
<strong style="text-align: center;">1099.993</strong></td>
<td>
<strong style="text-align: center;">1106.10</strong></td>
<td>
<strong style="text-align: center;">1109.48333</strong></td>
<td>
<strong style="text-align: center;">1115.59</strong></td>
<td>
<strong style="text-align: center;">1118.973</strong></td>
<td>
<strong style="text-align: center;">1125.08</strong></td>
<td>
<strong style="text-align: center;">1128.463</strong></td>
</tr>
</tbody>
</table>
<p>
<strong>Turnover table:</strong></p>
<p>
<strong>Today’s (2<sup>nd</sup>falgun) volume : Rs 216.65 corers/ Rs. 191.76 corers</strong></p>
<p>
<strong>Yesterdays (1<sup>st</sup>falgun) volume : Rs 23.88 corers</strong></p>
<p>
</p>
<p>
<strong><img alt="" src="/app/webroot/userfiles/images/3%2815%29.jpg" style="width: 800px; height: 600px;" /></strong></p>
<p>
Chart: NEPSE Daily Candle stick </p>
',
'published' => true,
'created' => '2019-02-15',
'modified' => '2019-02-15',
'keywords' => '',
'description' => '',
'sortorder' => '9850',
'image' => '20190215055323_1.jpg',
'article_date' => '2019-02-15 00:00:00',
'homepage' => true,
'breaking_news' => false,
'main_news' => false,
'in_scroller' => false,
'user_id' => '22'
),
'ArticleCategory' => array(
'id' => '1',
'name' => 'NEWS',
'parentOf' => '0',
'published' => true,
'registered' => '2015-07-20 00:00:00',
'sortorder' => '158',
'del_flag' => '0',
'homepage' => true,
'display_in_menu' => true,
'user_id' => '1',
'created' => '0000-00-00 00:00:00',
'modified' => '2018-11-22 11:58:49'
),
'User' => array(
'password' => '*****',
'id' => '22',
'user_detail_id' => '1',
'group_id' => '24',
'username' => 'kishor.bam@newbusinessage.com',
'name' => '',
'email' => 'kishor.bam@newbusinessage.com',
'address' => '',
'gender' => '',
'access' => '1',
'phone' => '',
'access_type' => '0',
'activated' => false,
'sortorder' => '0',
'published' => '0',
'created' => '2018-11-30 10:47:22',
'last_login' => '2019-06-09 10:32:40',
'ip' => '202.63.242.112'
),
'ArticleComment' => array(),
'ArticleFeature' => array(),
'ArticleHasAuthor' => array(),
'ArticleHasTag' => array(),
'ArticleView' => array(
(int) 0 => array(
[maximum depth reached]
)
),
'Slider' => array()
),
'current_user' => null,
'logged_in' => false
)
$article = array(
'Article' => array(
'id' => '10083',
'article_category_id' => '1',
'title' => 'Weekly Analysis ',
'sub_title' => '',
'summary' => 'While analyzing the trading volume an anomaly could be observed.',
'content' => '<p>
<strong> </strong>Chart 1. Nepse Weekly Candle stick pattern</p>
<p>
<strong>Nepse Index CMP: 1112.87 Anticipated Range for next week: 1098.51 to 1126.51</strong></p>
<p>
<strong>The pivot table for</strong></p>
<table align="left" border="1" cellpadding="0" cellspacing="0" style="width:658px;" width="658">
<tbody>
<tr>
<td style="width:94px;height:23px;">
<p>
<strong>S3</strong></p>
</td>
<td style="width:94px;height:23px;">
<p>
<strong>S2</strong></p>
</td>
<td style="width:94px;height:23px;">
<p>
<strong>S1</strong></p>
</td>
<td style="width:88px;height:23px;">
<p>
<strong>Pivot</strong></p>
</td>
<td style="width:96px;height:23px;">
<p>
<strong>R1</strong></p>
</td>
<td style="width:96px;height:23px;">
<p>
<strong>R2</strong></p>
</td>
<td style="width:96px;height:23px;">
<p>
<strong>R3</strong></p>
</td>
</tr>
<tr>
<td style="width:94px;height:23px;">
<p>
1075.30</p>
</td>
<td style="width:94px;height:23px;">
<p>
1093.72</p>
</td>
<td style="width:94px;height:23px;">
<p>
1103.30</p>
</td>
<td style="width:88px;height:23px;">
<p>
<strong>1121.72</strong></p>
</td>
<td style="width:96px;height:23px;">
<p>
1131.30</p>
</td>
<td style="width:96px;height:23px;">
<p>
1149.72</p>
</td>
<td style="width:96px;height:23px;">
<p>
1159.30</p>
</td>
</tr>
</tbody>
</table>
<p>
</p>
<p>
</p>
<p>
</p>
<p>
</p>
<p>
This week (Magh 27<sup>th</sup> to Falgun 2<sup>nd</sup>) trading volume: Rs 303.74 crores/ Rs 111.98 Crores</p>
<p>
Last week’s (Magh 20<sup>th</sup> to 24<sup>th</sup>) trading volume: Rs 150.45 Crores</p>
<p>
<strong>The Trading volume:</strong></p>
<p>
While analyzing the trading volume an anomaly could be observed. That is this week’s trading volume seems too higher compared to the previous week, this is because of the weekly last day a big volume of scrips EBL promoter share has been traded in market to make a total of Rs 303.74 for the week. If this particular trade is excluded then the average weekly transaction volume should be Rs 111.98 crores. So this puts the anomaly to market as the first figure is greater than the last week trading volume while the second figure is lower than the last week trading volume which Is Rs150.45 crores. In the first case, the volume should be indicated as bearish volume while in second case the volume is not bearish. If the bearish volume dominates the market then further price slide is expected and if not then saturation with support is expected.</p>
<p>
<strong>Candle sticks Pattern:</strong></p>
<p>
While observing Nepse weekly candle stick (Chart 1), if market sustains current level and bounce back above next week’s pivot with rise in volume then double bottom candle stick pattern is formed and the market should go up. But if current level is not sustained and market slides blow current level then further medium sized slides are ahead.</p>
<p>
Monthly candle stick pattern also suggests the market with the same support level as weekly. Chart 2 illustrates the monthly candle stick chart.</p>
<p>
<strong>Fundamental Analysis:</strong></p>
<ol>
<li>
1. The 3<sup>rd</sup> quarter of the fiscal year has begun. The financial statements of optimum company havebeen already published and that is mixed.</li>
<li>
2.There are few companies whose profit ratio has risen but their prices are over sold. So these scrips are good for buying at current level and its best if the price further slides.</li>
<li style="text-align: justify;">
3.Economic indicators show the twin deficits as foe viz. Trade deficits and current account deficits. We have been facing the trade deficits for quite long but since recent past we have also been facing current account deficits which should be addressed by government policy.</li>
<li>
4.The risk of the twin deficits have been averse by the remittance ( GNP) in short term. That is good but how long?</li>
<li>
5.The foreign reserve is satisfactory though.</li>
<li>
6.GDP forecast is approx. 6 pc</li>
</ol>
<p>
</p>
<p>
</p>
<p>
<img alt="" src="/app/webroot/userfiles/images/2%2816%29.jpg" style="width: 800px; height: 600px;" /></p>
<p>
Chart : Nepse monthly candle stick pattern</p>
<p>
Happy Trading………!!!!!!!</p>
<p>
<strong>The pivot table for tomorrow (5<sup>th </sup>falgun)</strong></p>
<table border="1" cellpadding="1" cellspacing="1" style="width: 500px">
<tbody>
<tr>
<td>
<strong>S3</strong></td>
<td>
<strong>S2</strong></td>
<td>
<strong>S1</strong></td>
<td>
<strong>P</strong></td>
<td>
<strong>R1</strong></td>
<td>
<strong>R2</strong></td>
<td>
<strong>R3</strong></td>
</tr>
<tr>
<td>
<strong style="text-align: center;">1099.993</strong></td>
<td>
<strong style="text-align: center;">1106.10</strong></td>
<td>
<strong style="text-align: center;">1109.48333</strong></td>
<td>
<strong style="text-align: center;">1115.59</strong></td>
<td>
<strong style="text-align: center;">1118.973</strong></td>
<td>
<strong style="text-align: center;">1125.08</strong></td>
<td>
<strong style="text-align: center;">1128.463</strong></td>
</tr>
</tbody>
</table>
<p>
<strong>Turnover table:</strong></p>
<p>
<strong>Today’s (2<sup>nd</sup>falgun) volume : Rs 216.65 corers/ Rs. 191.76 corers</strong></p>
<p>
<strong>Yesterdays (1<sup>st</sup>falgun) volume : Rs 23.88 corers</strong></p>
<p>
</p>
<p>
<strong><img alt="" src="/app/webroot/userfiles/images/3%2815%29.jpg" style="width: 800px; height: 600px;" /></strong></p>
<p>
Chart: NEPSE Daily Candle stick </p>
',
'published' => true,
'created' => '2019-02-15',
'modified' => '2019-02-15',
'keywords' => '',
'description' => '',
'sortorder' => '9850',
'image' => '20190215055323_1.jpg',
'article_date' => '2019-02-15 00:00:00',
'homepage' => true,
'breaking_news' => false,
'main_news' => false,
'in_scroller' => false,
'user_id' => '22'
),
'ArticleCategory' => array(
'id' => '1',
'name' => 'NEWS',
'parentOf' => '0',
'published' => true,
'registered' => '2015-07-20 00:00:00',
'sortorder' => '158',
'del_flag' => '0',
'homepage' => true,
'display_in_menu' => true,
'user_id' => '1',
'created' => '0000-00-00 00:00:00',
'modified' => '2018-11-22 11:58:49'
),
'User' => array(
'password' => '*****',
'id' => '22',
'user_detail_id' => '1',
'group_id' => '24',
'username' => 'kishor.bam@newbusinessage.com',
'name' => '',
'email' => 'kishor.bam@newbusinessage.com',
'address' => '',
'gender' => '',
'access' => '1',
'phone' => '',
'access_type' => '0',
'activated' => false,
'sortorder' => '0',
'published' => '0',
'created' => '2018-11-30 10:47:22',
'last_login' => '2019-06-09 10:32:40',
'ip' => '202.63.242.112'
),
'ArticleComment' => array(),
'ArticleFeature' => array(),
'ArticleHasAuthor' => array(),
'ArticleHasTag' => array(),
'ArticleView' => array(
(int) 0 => array(
'article_id' => '10083',
'hit' => '1059'
)
),
'Slider' => array()
)
$current_user = null
$logged_in = false
$xml = false
include - APP/View/Elements/side_bar.ctp, line 133
View::_evaluate() - CORE/Cake/View/View.php, line 971
View::_render() - CORE/Cake/View/View.php, line 933
View::_renderElement() - CORE/Cake/View/View.php, line 1224
View::element() - CORE/Cake/View/View.php, line 418
include - APP/View/Articles/view.ctp, line 391
View::_evaluate() - CORE/Cake/View/View.php, line 971
View::_render() - CORE/Cake/View/View.php, line 933
View::render() - CORE/Cake/View/View.php, line 473
Controller::render() - CORE/Cake/Controller/Controller.php, line 968
Dispatcher::_invoke() - CORE/Cake/Routing/Dispatcher.php, line 200
Dispatcher::dispatch() - CORE/Cake/Routing/Dispatcher.php, line 167
[main] - APP/webroot/index.php, line 117
Warning (2): simplexml_load_file() [<a href='http://php.net/function.simplexml-load-file'>function.simplexml-load-file</a>]: I/O warning : failed to load external entity "" [APP/View/Elements/side_bar.ctp, line 133]
$viewFile = '/var/www/html/newbusinessage.com/app/View/Elements/side_bar.ctp'
$dataForView = array(
'article' => array(
'Article' => array(
'id' => '10083',
'article_category_id' => '1',
'title' => 'Weekly Analysis ',
'sub_title' => '',
'summary' => 'While analyzing the trading volume an anomaly could be observed.',
'content' => '<p>
<strong> </strong>Chart 1. Nepse Weekly Candle stick pattern</p>
<p>
<strong>Nepse Index CMP: 1112.87 Anticipated Range for next week: 1098.51 to 1126.51</strong></p>
<p>
<strong>The pivot table for</strong></p>
<table align="left" border="1" cellpadding="0" cellspacing="0" style="width:658px;" width="658">
<tbody>
<tr>
<td style="width:94px;height:23px;">
<p>
<strong>S3</strong></p>
</td>
<td style="width:94px;height:23px;">
<p>
<strong>S2</strong></p>
</td>
<td style="width:94px;height:23px;">
<p>
<strong>S1</strong></p>
</td>
<td style="width:88px;height:23px;">
<p>
<strong>Pivot</strong></p>
</td>
<td style="width:96px;height:23px;">
<p>
<strong>R1</strong></p>
</td>
<td style="width:96px;height:23px;">
<p>
<strong>R2</strong></p>
</td>
<td style="width:96px;height:23px;">
<p>
<strong>R3</strong></p>
</td>
</tr>
<tr>
<td style="width:94px;height:23px;">
<p>
1075.30</p>
</td>
<td style="width:94px;height:23px;">
<p>
1093.72</p>
</td>
<td style="width:94px;height:23px;">
<p>
1103.30</p>
</td>
<td style="width:88px;height:23px;">
<p>
<strong>1121.72</strong></p>
</td>
<td style="width:96px;height:23px;">
<p>
1131.30</p>
</td>
<td style="width:96px;height:23px;">
<p>
1149.72</p>
</td>
<td style="width:96px;height:23px;">
<p>
1159.30</p>
</td>
</tr>
</tbody>
</table>
<p>
</p>
<p>
</p>
<p>
</p>
<p>
</p>
<p>
This week (Magh 27<sup>th</sup> to Falgun 2<sup>nd</sup>) trading volume: Rs 303.74 crores/ Rs 111.98 Crores</p>
<p>
Last week’s (Magh 20<sup>th</sup> to 24<sup>th</sup>) trading volume: Rs 150.45 Crores</p>
<p>
<strong>The Trading volume:</strong></p>
<p>
While analyzing the trading volume an anomaly could be observed. That is this week’s trading volume seems too higher compared to the previous week, this is because of the weekly last day a big volume of scrips EBL promoter share has been traded in market to make a total of Rs 303.74 for the week. If this particular trade is excluded then the average weekly transaction volume should be Rs 111.98 crores. So this puts the anomaly to market as the first figure is greater than the last week trading volume while the second figure is lower than the last week trading volume which Is Rs150.45 crores. In the first case, the volume should be indicated as bearish volume while in second case the volume is not bearish. If the bearish volume dominates the market then further price slide is expected and if not then saturation with support is expected.</p>
<p>
<strong>Candle sticks Pattern:</strong></p>
<p>
While observing Nepse weekly candle stick (Chart 1), if market sustains current level and bounce back above next week’s pivot with rise in volume then double bottom candle stick pattern is formed and the market should go up. But if current level is not sustained and market slides blow current level then further medium sized slides are ahead.</p>
<p>
Monthly candle stick pattern also suggests the market with the same support level as weekly. Chart 2 illustrates the monthly candle stick chart.</p>
<p>
<strong>Fundamental Analysis:</strong></p>
<ol>
<li>
1. The 3<sup>rd</sup> quarter of the fiscal year has begun. The financial statements of optimum company havebeen already published and that is mixed.</li>
<li>
2.There are few companies whose profit ratio has risen but their prices are over sold. So these scrips are good for buying at current level and its best if the price further slides.</li>
<li style="text-align: justify;">
3.Economic indicators show the twin deficits as foe viz. Trade deficits and current account deficits. We have been facing the trade deficits for quite long but since recent past we have also been facing current account deficits which should be addressed by government policy.</li>
<li>
4.The risk of the twin deficits have been averse by the remittance ( GNP) in short term. That is good but how long?</li>
<li>
5.The foreign reserve is satisfactory though.</li>
<li>
6.GDP forecast is approx. 6 pc</li>
</ol>
<p>
</p>
<p>
</p>
<p>
<img alt="" src="/app/webroot/userfiles/images/2%2816%29.jpg" style="width: 800px; height: 600px;" /></p>
<p>
Chart : Nepse monthly candle stick pattern</p>
<p>
Happy Trading………!!!!!!!</p>
<p>
<strong>The pivot table for tomorrow (5<sup>th </sup>falgun)</strong></p>
<table border="1" cellpadding="1" cellspacing="1" style="width: 500px">
<tbody>
<tr>
<td>
<strong>S3</strong></td>
<td>
<strong>S2</strong></td>
<td>
<strong>S1</strong></td>
<td>
<strong>P</strong></td>
<td>
<strong>R1</strong></td>
<td>
<strong>R2</strong></td>
<td>
<strong>R3</strong></td>
</tr>
<tr>
<td>
<strong style="text-align: center;">1099.993</strong></td>
<td>
<strong style="text-align: center;">1106.10</strong></td>
<td>
<strong style="text-align: center;">1109.48333</strong></td>
<td>
<strong style="text-align: center;">1115.59</strong></td>
<td>
<strong style="text-align: center;">1118.973</strong></td>
<td>
<strong style="text-align: center;">1125.08</strong></td>
<td>
<strong style="text-align: center;">1128.463</strong></td>
</tr>
</tbody>
</table>
<p>
<strong>Turnover table:</strong></p>
<p>
<strong>Today’s (2<sup>nd</sup>falgun) volume : Rs 216.65 corers/ Rs. 191.76 corers</strong></p>
<p>
<strong>Yesterdays (1<sup>st</sup>falgun) volume : Rs 23.88 corers</strong></p>
<p>
</p>
<p>
<strong><img alt="" src="/app/webroot/userfiles/images/3%2815%29.jpg" style="width: 800px; height: 600px;" /></strong></p>
<p>
Chart: NEPSE Daily Candle stick </p>
',
'published' => true,
'created' => '2019-02-15',
'modified' => '2019-02-15',
'keywords' => '',
'description' => '',
'sortorder' => '9850',
'image' => '20190215055323_1.jpg',
'article_date' => '2019-02-15 00:00:00',
'homepage' => true,
'breaking_news' => false,
'main_news' => false,
'in_scroller' => false,
'user_id' => '22'
),
'ArticleCategory' => array(
'id' => '1',
'name' => 'NEWS',
'parentOf' => '0',
'published' => true,
'registered' => '2015-07-20 00:00:00',
'sortorder' => '158',
'del_flag' => '0',
'homepage' => true,
'display_in_menu' => true,
'user_id' => '1',
'created' => '0000-00-00 00:00:00',
'modified' => '2018-11-22 11:58:49'
),
'User' => array(
'password' => '*****',
'id' => '22',
'user_detail_id' => '1',
'group_id' => '24',
'username' => 'kishor.bam@newbusinessage.com',
'name' => '',
'email' => 'kishor.bam@newbusinessage.com',
'address' => '',
'gender' => '',
'access' => '1',
'phone' => '',
'access_type' => '0',
'activated' => false,
'sortorder' => '0',
'published' => '0',
'created' => '2018-11-30 10:47:22',
'last_login' => '2019-06-09 10:32:40',
'ip' => '202.63.242.112'
),
'ArticleComment' => array(),
'ArticleFeature' => array(),
'ArticleHasAuthor' => array(),
'ArticleHasTag' => array(),
'ArticleView' => array(
(int) 0 => array(
[maximum depth reached]
)
),
'Slider' => array()
),
'current_user' => null,
'logged_in' => false
)
$article = array(
'Article' => array(
'id' => '10083',
'article_category_id' => '1',
'title' => 'Weekly Analysis ',
'sub_title' => '',
'summary' => 'While analyzing the trading volume an anomaly could be observed.',
'content' => '<p>
<strong> </strong>Chart 1. Nepse Weekly Candle stick pattern</p>
<p>
<strong>Nepse Index CMP: 1112.87 Anticipated Range for next week: 1098.51 to 1126.51</strong></p>
<p>
<strong>The pivot table for</strong></p>
<table align="left" border="1" cellpadding="0" cellspacing="0" style="width:658px;" width="658">
<tbody>
<tr>
<td style="width:94px;height:23px;">
<p>
<strong>S3</strong></p>
</td>
<td style="width:94px;height:23px;">
<p>
<strong>S2</strong></p>
</td>
<td style="width:94px;height:23px;">
<p>
<strong>S1</strong></p>
</td>
<td style="width:88px;height:23px;">
<p>
<strong>Pivot</strong></p>
</td>
<td style="width:96px;height:23px;">
<p>
<strong>R1</strong></p>
</td>
<td style="width:96px;height:23px;">
<p>
<strong>R2</strong></p>
</td>
<td style="width:96px;height:23px;">
<p>
<strong>R3</strong></p>
</td>
</tr>
<tr>
<td style="width:94px;height:23px;">
<p>
1075.30</p>
</td>
<td style="width:94px;height:23px;">
<p>
1093.72</p>
</td>
<td style="width:94px;height:23px;">
<p>
1103.30</p>
</td>
<td style="width:88px;height:23px;">
<p>
<strong>1121.72</strong></p>
</td>
<td style="width:96px;height:23px;">
<p>
1131.30</p>
</td>
<td style="width:96px;height:23px;">
<p>
1149.72</p>
</td>
<td style="width:96px;height:23px;">
<p>
1159.30</p>
</td>
</tr>
</tbody>
</table>
<p>
</p>
<p>
</p>
<p>
</p>
<p>
</p>
<p>
This week (Magh 27<sup>th</sup> to Falgun 2<sup>nd</sup>) trading volume: Rs 303.74 crores/ Rs 111.98 Crores</p>
<p>
Last week’s (Magh 20<sup>th</sup> to 24<sup>th</sup>) trading volume: Rs 150.45 Crores</p>
<p>
<strong>The Trading volume:</strong></p>
<p>
While analyzing the trading volume an anomaly could be observed. That is this week’s trading volume seems too higher compared to the previous week, this is because of the weekly last day a big volume of scrips EBL promoter share has been traded in market to make a total of Rs 303.74 for the week. If this particular trade is excluded then the average weekly transaction volume should be Rs 111.98 crores. So this puts the anomaly to market as the first figure is greater than the last week trading volume while the second figure is lower than the last week trading volume which Is Rs150.45 crores. In the first case, the volume should be indicated as bearish volume while in second case the volume is not bearish. If the bearish volume dominates the market then further price slide is expected and if not then saturation with support is expected.</p>
<p>
<strong>Candle sticks Pattern:</strong></p>
<p>
While observing Nepse weekly candle stick (Chart 1), if market sustains current level and bounce back above next week’s pivot with rise in volume then double bottom candle stick pattern is formed and the market should go up. But if current level is not sustained and market slides blow current level then further medium sized slides are ahead.</p>
<p>
Monthly candle stick pattern also suggests the market with the same support level as weekly. Chart 2 illustrates the monthly candle stick chart.</p>
<p>
<strong>Fundamental Analysis:</strong></p>
<ol>
<li>
1. The 3<sup>rd</sup> quarter of the fiscal year has begun. The financial statements of optimum company havebeen already published and that is mixed.</li>
<li>
2.There are few companies whose profit ratio has risen but their prices are over sold. So these scrips are good for buying at current level and its best if the price further slides.</li>
<li style="text-align: justify;">
3.Economic indicators show the twin deficits as foe viz. Trade deficits and current account deficits. We have been facing the trade deficits for quite long but since recent past we have also been facing current account deficits which should be addressed by government policy.</li>
<li>
4.The risk of the twin deficits have been averse by the remittance ( GNP) in short term. That is good but how long?</li>
<li>
5.The foreign reserve is satisfactory though.</li>
<li>
6.GDP forecast is approx. 6 pc</li>
</ol>
<p>
</p>
<p>
</p>
<p>
<img alt="" src="/app/webroot/userfiles/images/2%2816%29.jpg" style="width: 800px; height: 600px;" /></p>
<p>
Chart : Nepse monthly candle stick pattern</p>
<p>
Happy Trading………!!!!!!!</p>
<p>
<strong>The pivot table for tomorrow (5<sup>th </sup>falgun)</strong></p>
<table border="1" cellpadding="1" cellspacing="1" style="width: 500px">
<tbody>
<tr>
<td>
<strong>S3</strong></td>
<td>
<strong>S2</strong></td>
<td>
<strong>S1</strong></td>
<td>
<strong>P</strong></td>
<td>
<strong>R1</strong></td>
<td>
<strong>R2</strong></td>
<td>
<strong>R3</strong></td>
</tr>
<tr>
<td>
<strong style="text-align: center;">1099.993</strong></td>
<td>
<strong style="text-align: center;">1106.10</strong></td>
<td>
<strong style="text-align: center;">1109.48333</strong></td>
<td>
<strong style="text-align: center;">1115.59</strong></td>
<td>
<strong style="text-align: center;">1118.973</strong></td>
<td>
<strong style="text-align: center;">1125.08</strong></td>
<td>
<strong style="text-align: center;">1128.463</strong></td>
</tr>
</tbody>
</table>
<p>
<strong>Turnover table:</strong></p>
<p>
<strong>Today’s (2<sup>nd</sup>falgun) volume : Rs 216.65 corers/ Rs. 191.76 corers</strong></p>
<p>
<strong>Yesterdays (1<sup>st</sup>falgun) volume : Rs 23.88 corers</strong></p>
<p>
</p>
<p>
<strong><img alt="" src="/app/webroot/userfiles/images/3%2815%29.jpg" style="width: 800px; height: 600px;" /></strong></p>
<p>
Chart: NEPSE Daily Candle stick </p>
',
'published' => true,
'created' => '2019-02-15',
'modified' => '2019-02-15',
'keywords' => '',
'description' => '',
'sortorder' => '9850',
'image' => '20190215055323_1.jpg',
'article_date' => '2019-02-15 00:00:00',
'homepage' => true,
'breaking_news' => false,
'main_news' => false,
'in_scroller' => false,
'user_id' => '22'
),
'ArticleCategory' => array(
'id' => '1',
'name' => 'NEWS',
'parentOf' => '0',
'published' => true,
'registered' => '2015-07-20 00:00:00',
'sortorder' => '158',
'del_flag' => '0',
'homepage' => true,
'display_in_menu' => true,
'user_id' => '1',
'created' => '0000-00-00 00:00:00',
'modified' => '2018-11-22 11:58:49'
),
'User' => array(
'password' => '*****',
'id' => '22',
'user_detail_id' => '1',
'group_id' => '24',
'username' => 'kishor.bam@newbusinessage.com',
'name' => '',
'email' => 'kishor.bam@newbusinessage.com',
'address' => '',
'gender' => '',
'access' => '1',
'phone' => '',
'access_type' => '0',
'activated' => false,
'sortorder' => '0',
'published' => '0',
'created' => '2018-11-30 10:47:22',
'last_login' => '2019-06-09 10:32:40',
'ip' => '202.63.242.112'
),
'ArticleComment' => array(),
'ArticleFeature' => array(),
'ArticleHasAuthor' => array(),
'ArticleHasTag' => array(),
'ArticleView' => array(
(int) 0 => array(
'article_id' => '10083',
'hit' => '1059'
)
),
'Slider' => array()
)
$current_user = null
$logged_in = false
$xml = false
simplexml_load_file - [internal], line ??
include - APP/View/Elements/side_bar.ctp, line 133
View::_evaluate() - CORE/Cake/View/View.php, line 971
View::_render() - CORE/Cake/View/View.php, line 933
View::_renderElement() - CORE/Cake/View/View.php, line 1224
View::element() - CORE/Cake/View/View.php, line 418
include - APP/View/Articles/view.ctp, line 391
View::_evaluate() - CORE/Cake/View/View.php, line 971
View::_render() - CORE/Cake/View/View.php, line 933
View::render() - CORE/Cake/View/View.php, line 473
Controller::render() - CORE/Cake/Controller/Controller.php, line 968
Dispatcher::_invoke() - CORE/Cake/Routing/Dispatcher.php, line 200
Dispatcher::dispatch() - CORE/Cake/Routing/Dispatcher.php, line 167
[main] - APP/webroot/index.php, line 117